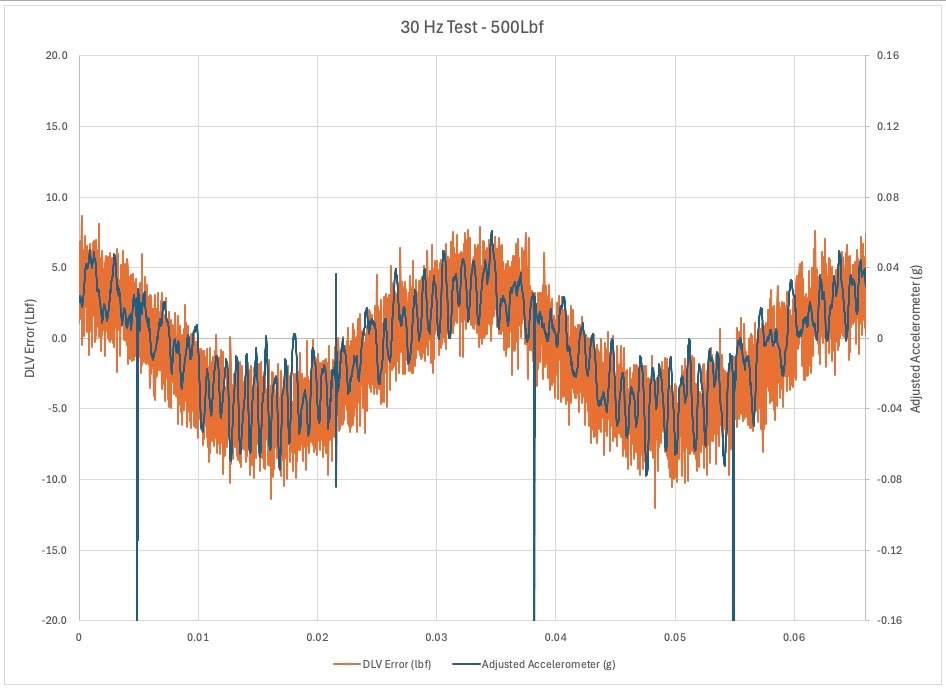
Sample Plot Series To AnalyzeTag4u: fjaa100525 < fjaa185457 < fjaareport < fjaastubJoe AlbrightApr 29, 20257ShareAnchor: PVS001 (TOP / FB top)SummaryThis series shows the correlation between an accelerometer and a dynamometer computed loading error.30 hz80 HzPreviousNext


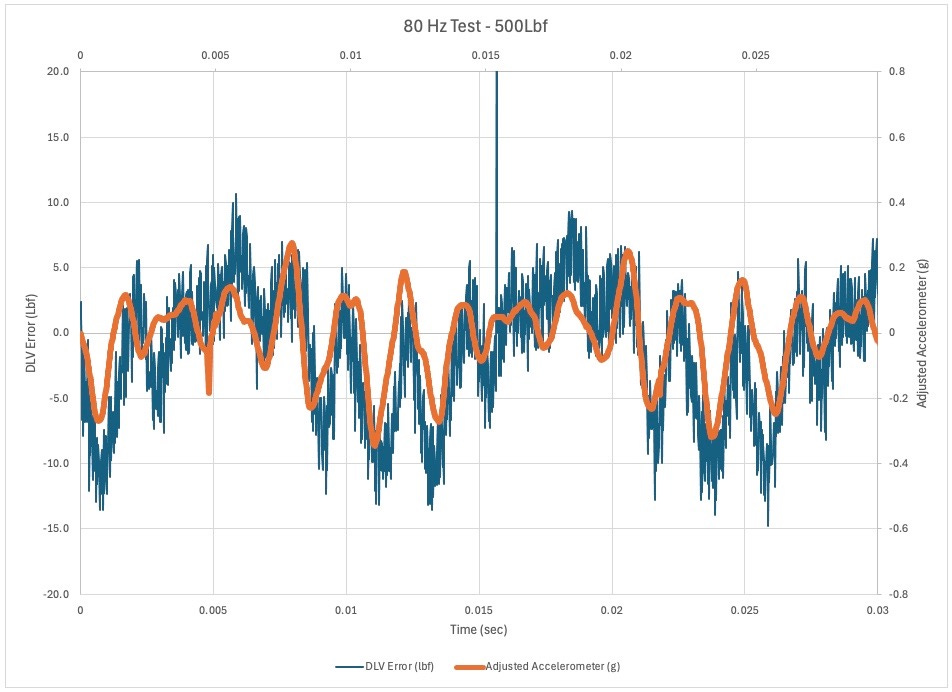
80 Hz has a period of 0.0125s so peak acceleration / error seems fairly well represented. The shorter period smaller waves look to be about 480 Hz. Could this be from applied dither?
Maybe a second harmonic