
PVS002f Analysis
Tag4u: fjaa200216

Summary
GoTo: Top / Comments / Introduction , Outline , Tutorials
TopicID: fjaa113036
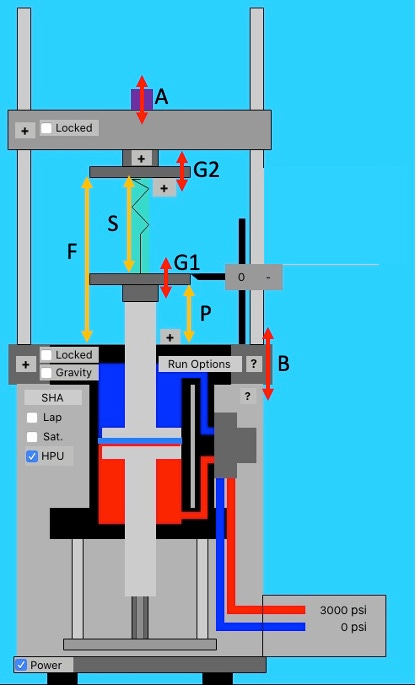
NOTE: This document presumes a basic understanding of a material test system, its motions, and its general performance envelope. Refer to the Theory of Operation section for background as needed.


This thread has observations about the 5 hz to 55 hz sine sweep test for frame 207, configuration TBD. Maximum load was 2000 lbf, R=0.1. Test data for analysis was collected using a sine sweep test waveform (more). By following this proposed process, numerous test points were then examined for the error between the test machine load signal and the dynamometer load signal. Some representative error plots are shown below.


Observations
TopicID: fjaa113036
Numerous observations were made for this analysis. These five are of primary interest. Search in this post for each observation’s TopicID (i.e. fjaaNNNNNN) so that you see the image and details that have been added thus far. Then return here and follow each observation’s comments link to read my explanation for why the observation was made as well as additional critiques of the thought process.
The static calibration of the dynamometer does not appear to match the required calibration of the dynamometer during quasi-static and low frequency operation (fjaa120021a).
There is a variable phase shift between the dynamometer and the test machine’s force cell that can not be explained presently(fjaa120021b).
A simple phase correction method was shown to be very effective at eliminating the phase shift between dynamometer and test machine force cell. The phase correction needed to be adjusted for each frequency of interest (more) (fjaa120021c).
Once phase correction has been applied, a simple scale (more) and offset (more) adjustment of the dynamometer consistently reduced the error signal to a nominally flat line with a noise band.(fjaa120021d).
The noise band’s frequency content was variable depending on the test machine’s operating frequency.(fjaa120021e).
Introduction
Up / Comments / Proposed Process , Outline
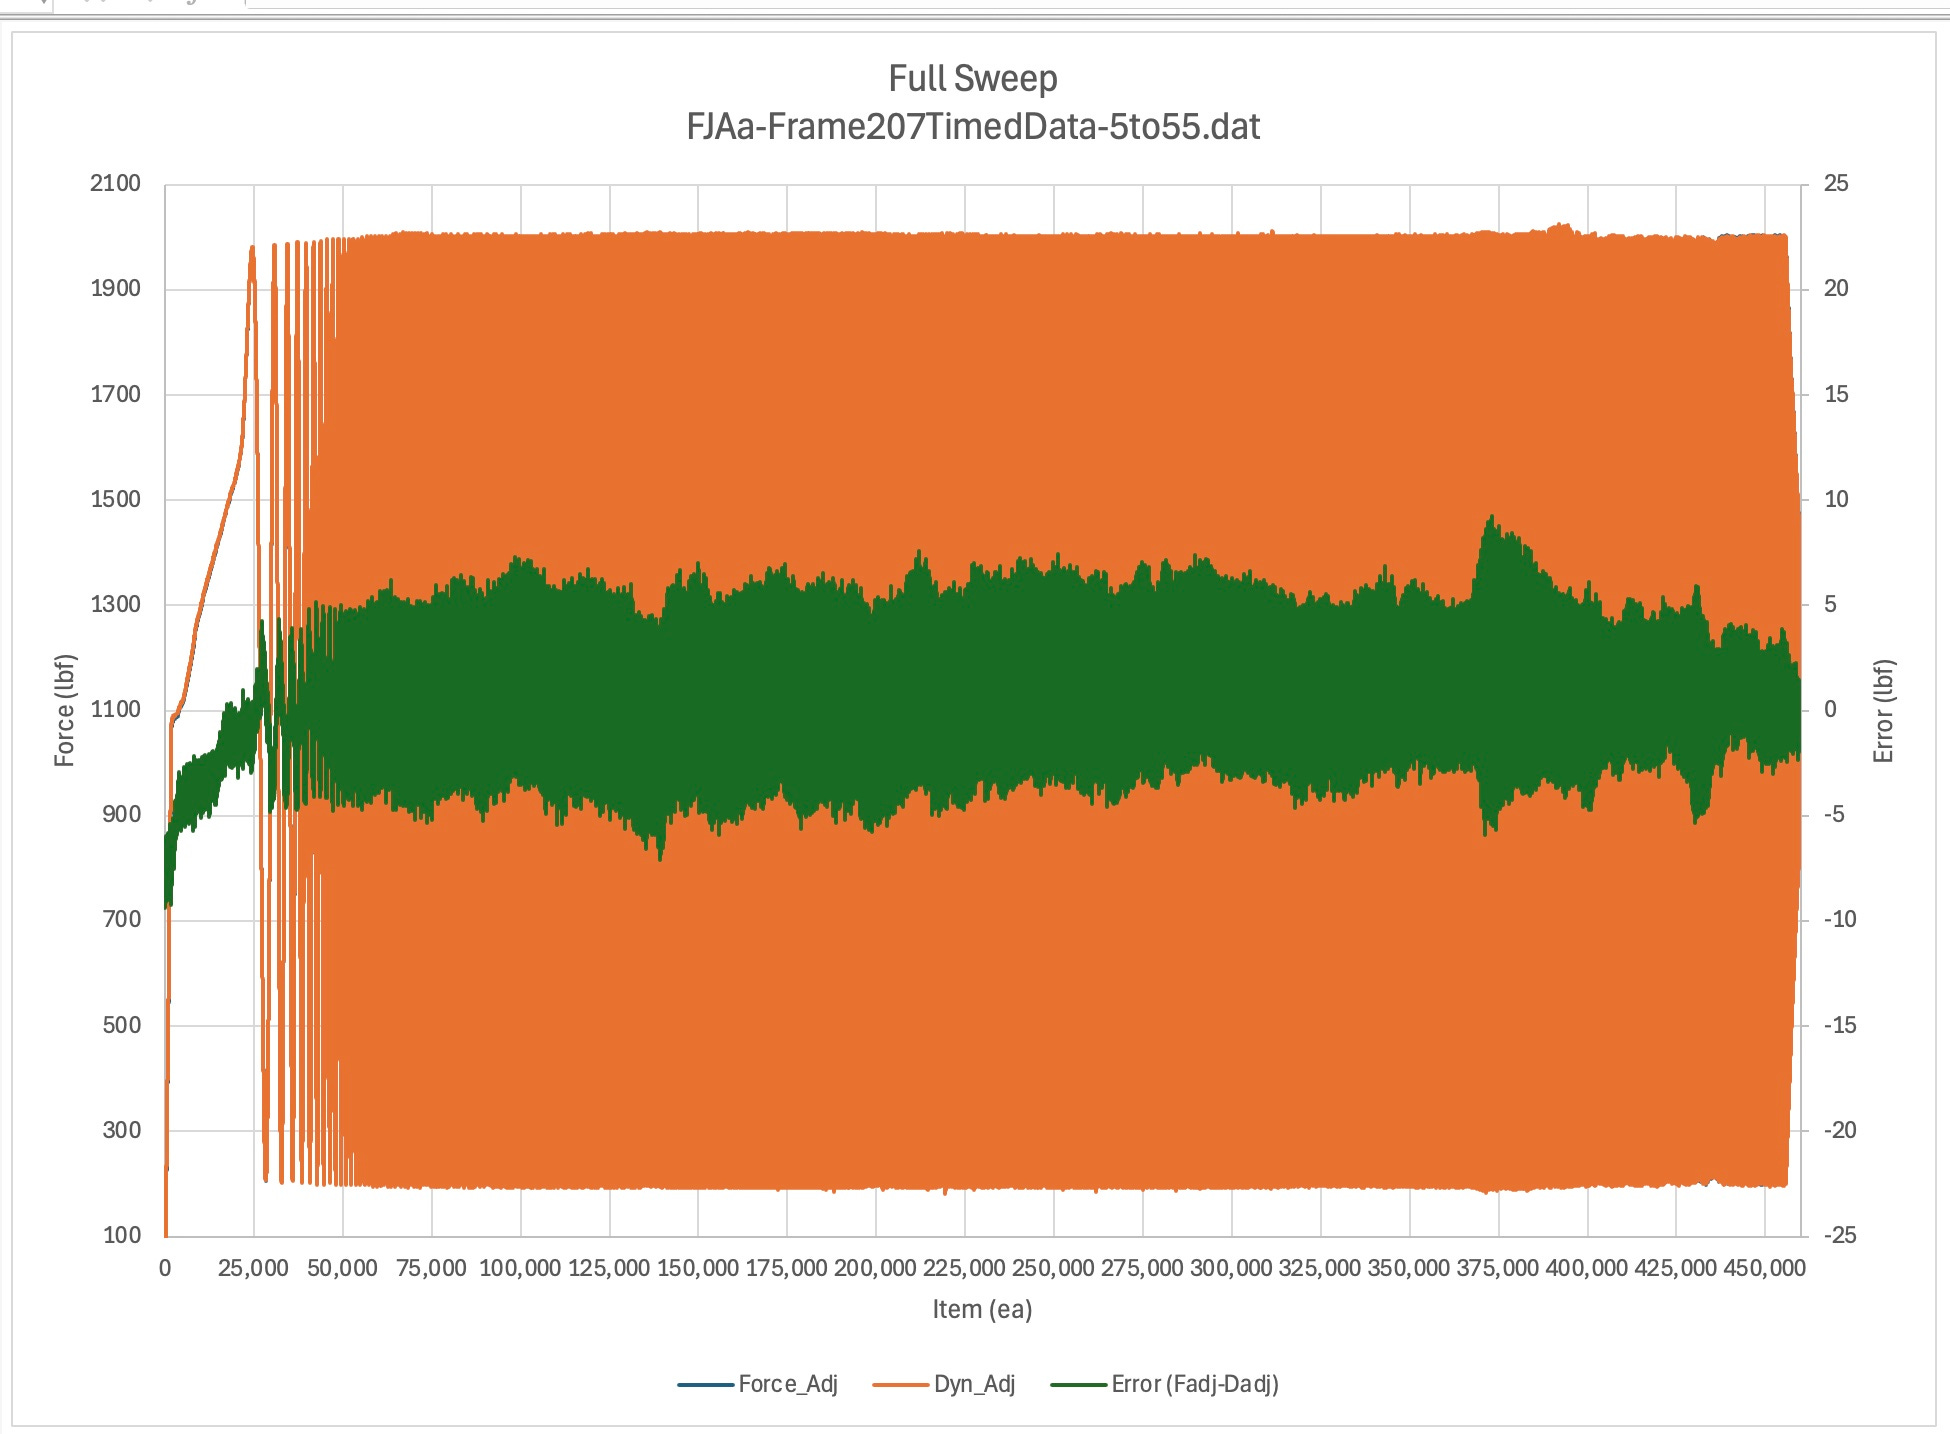
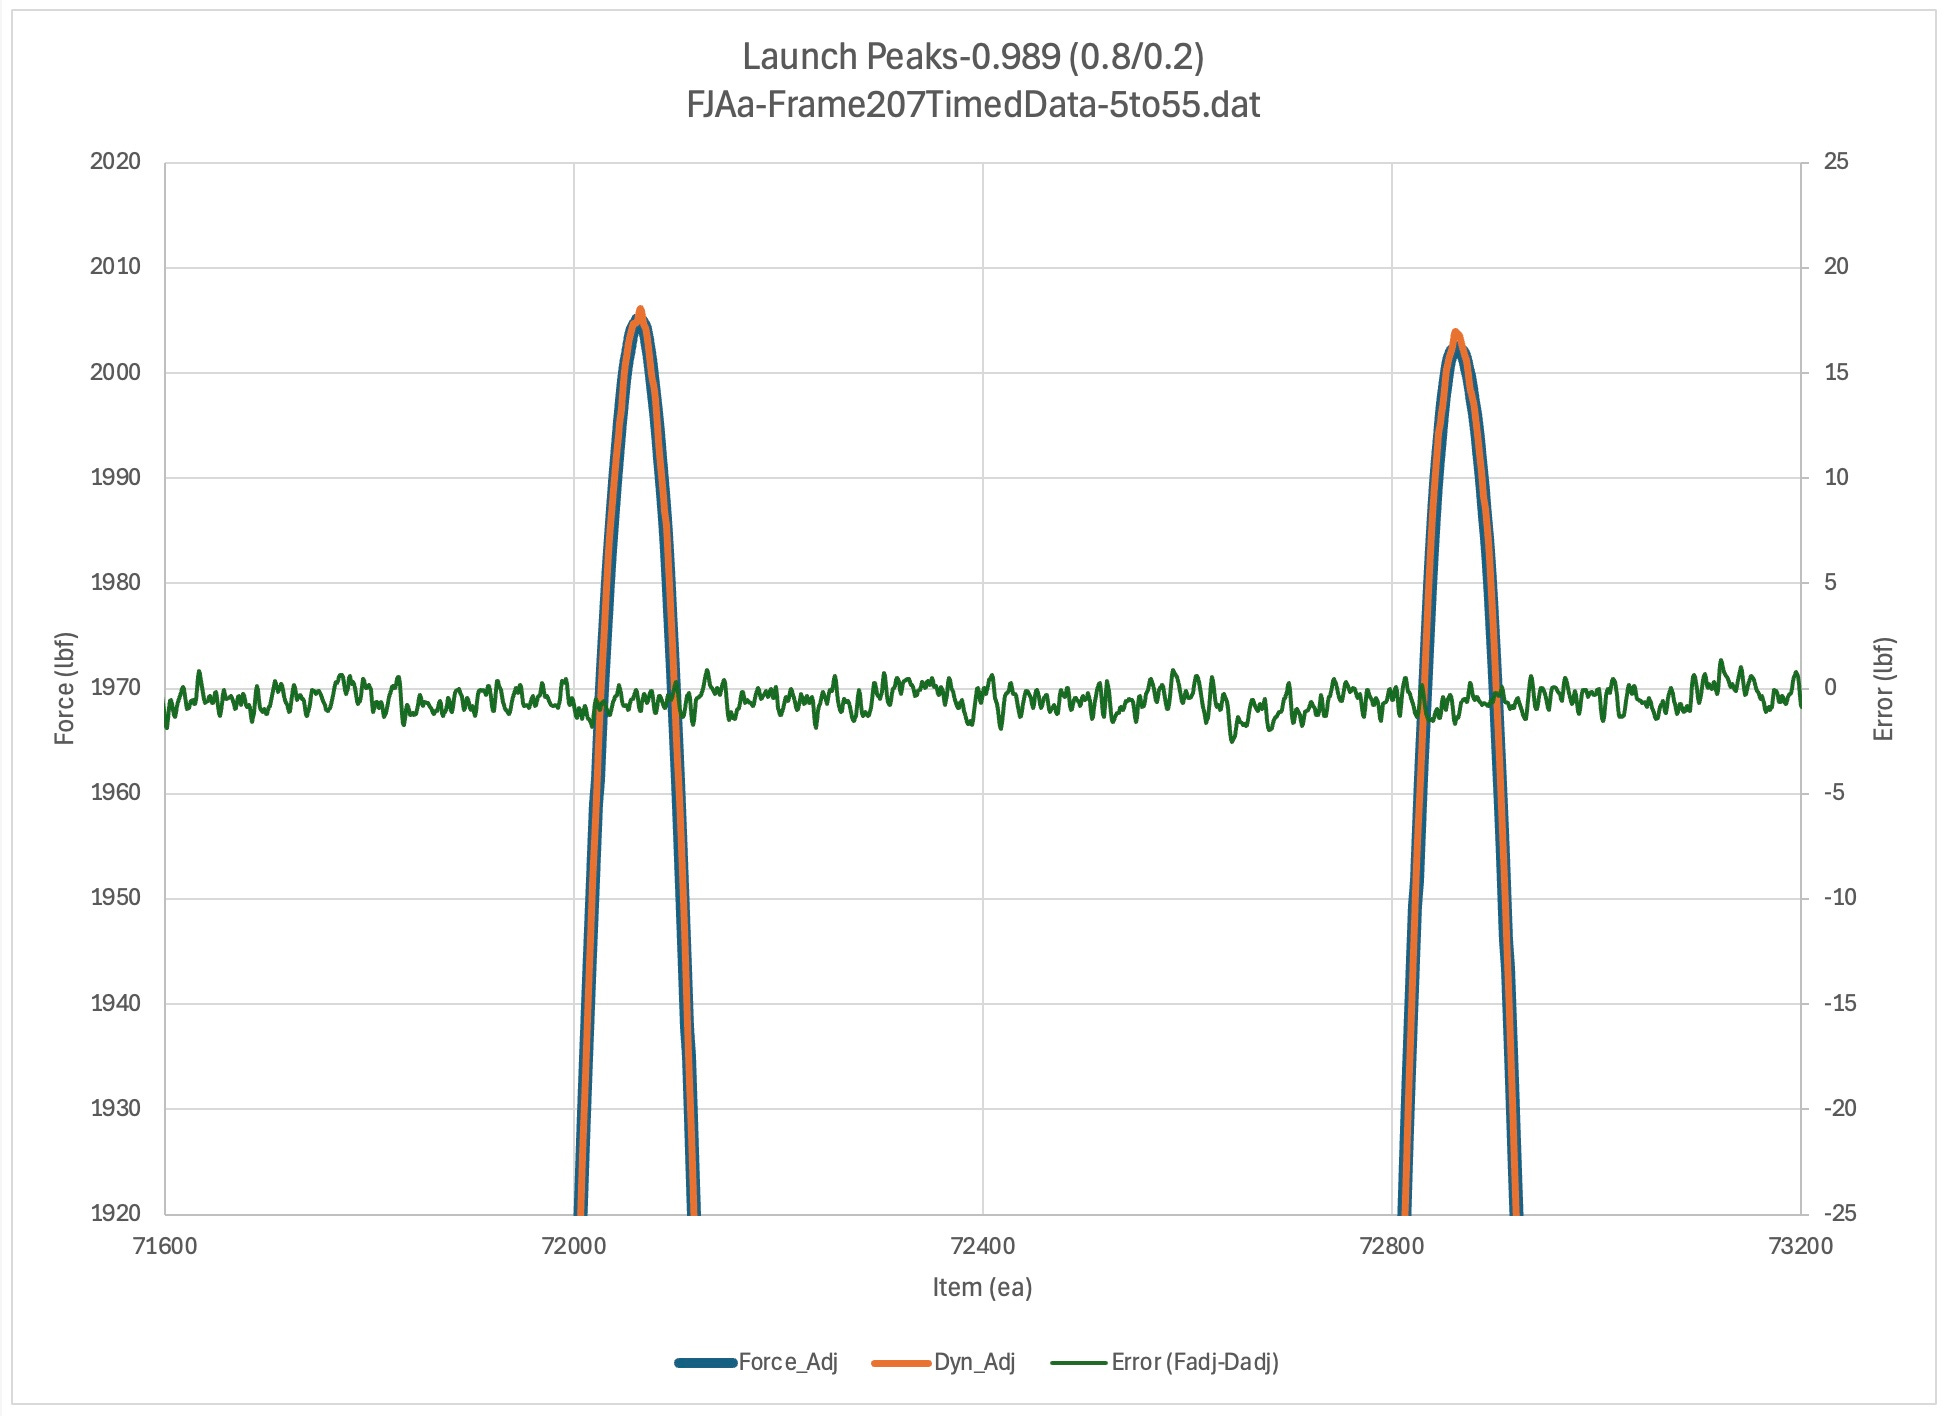
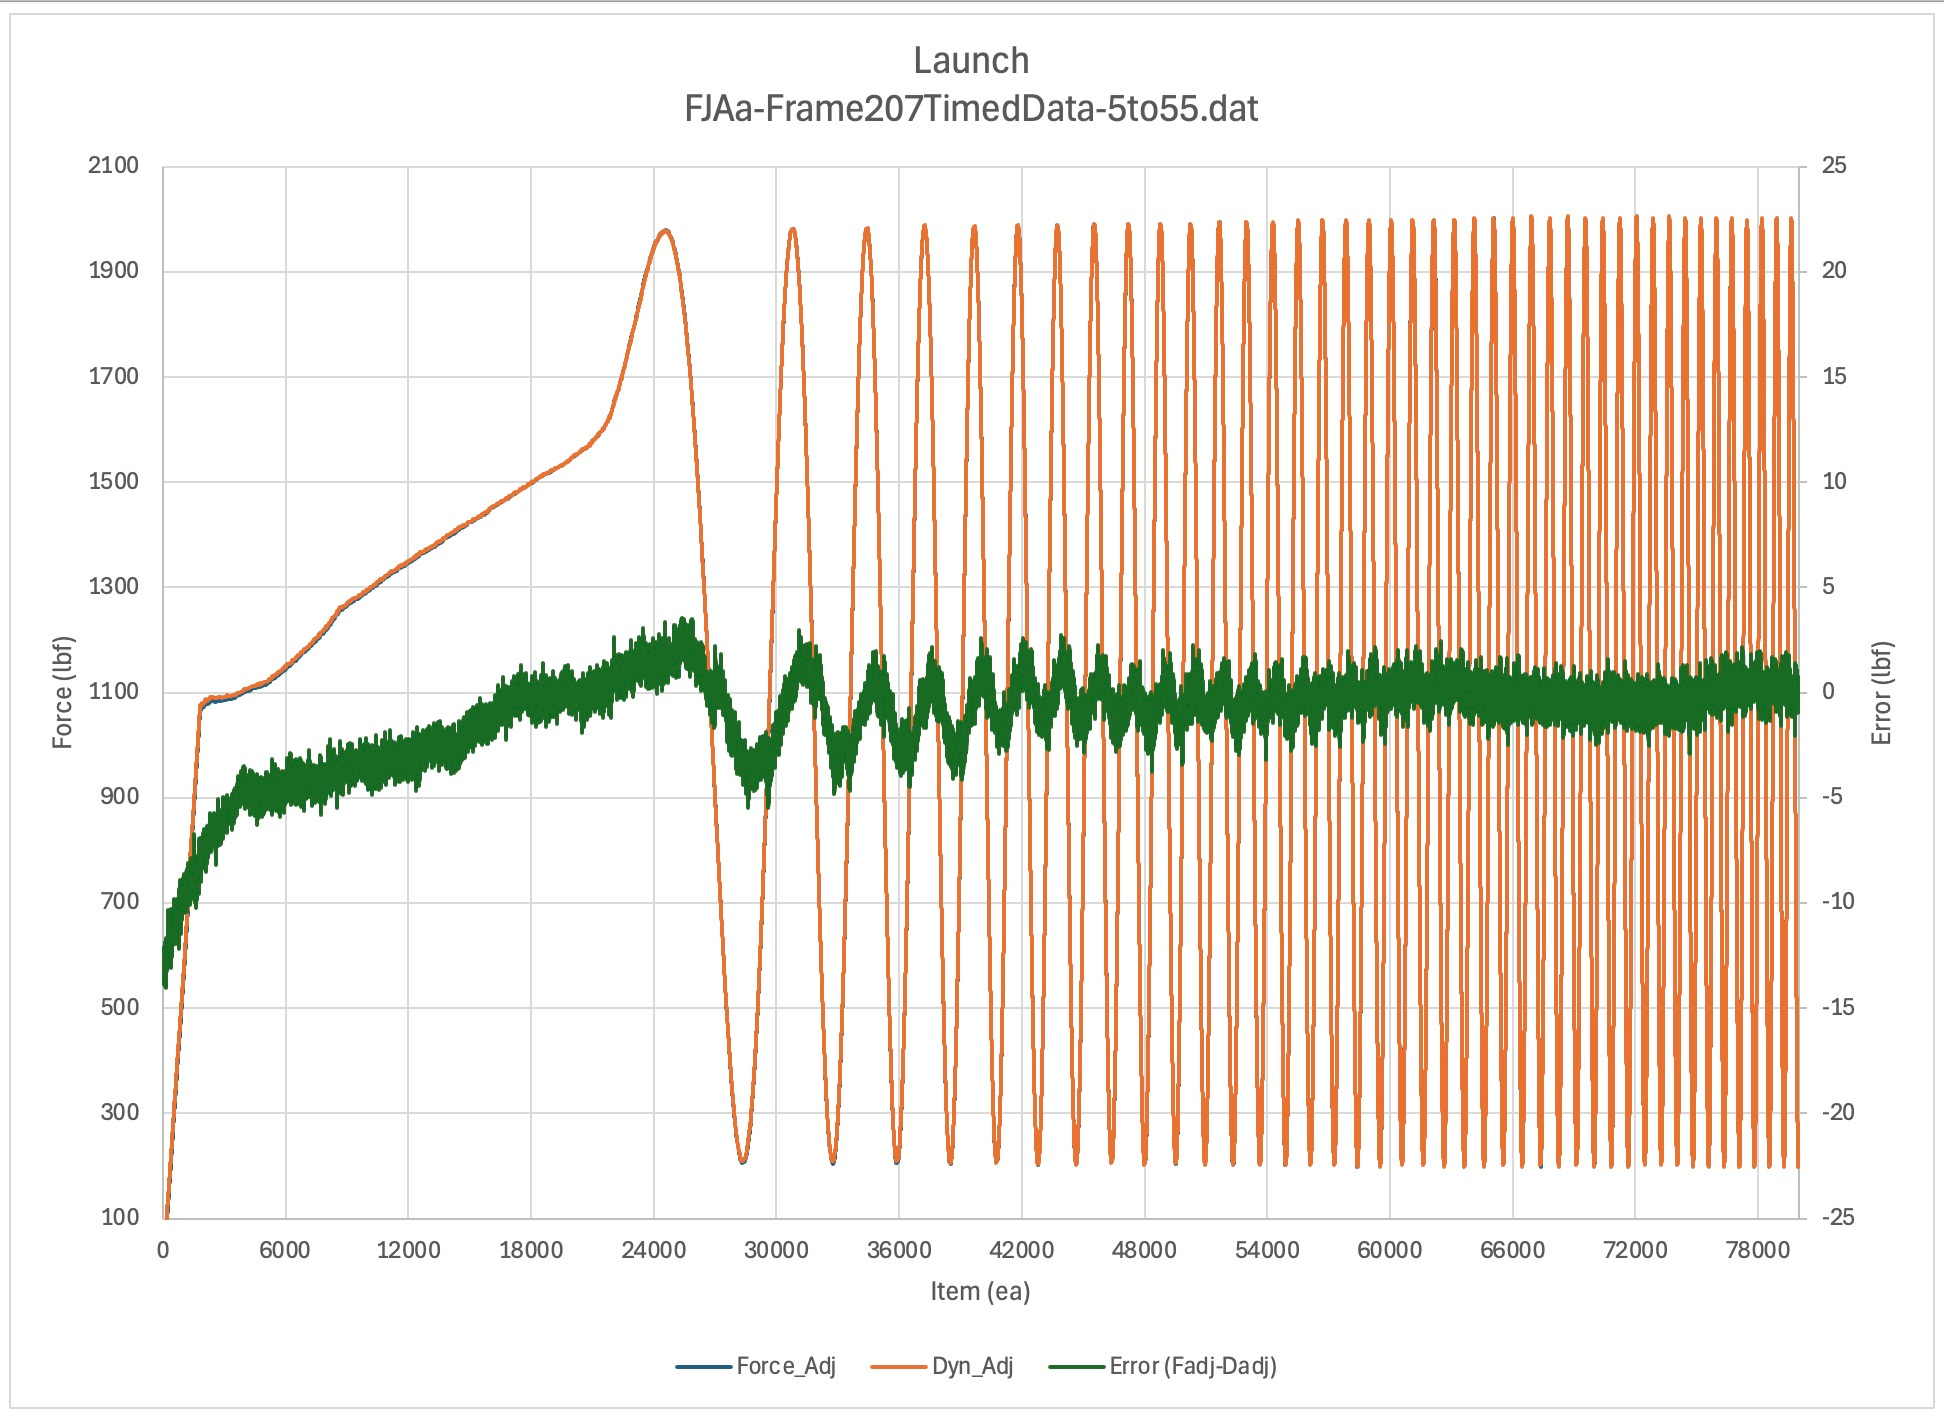
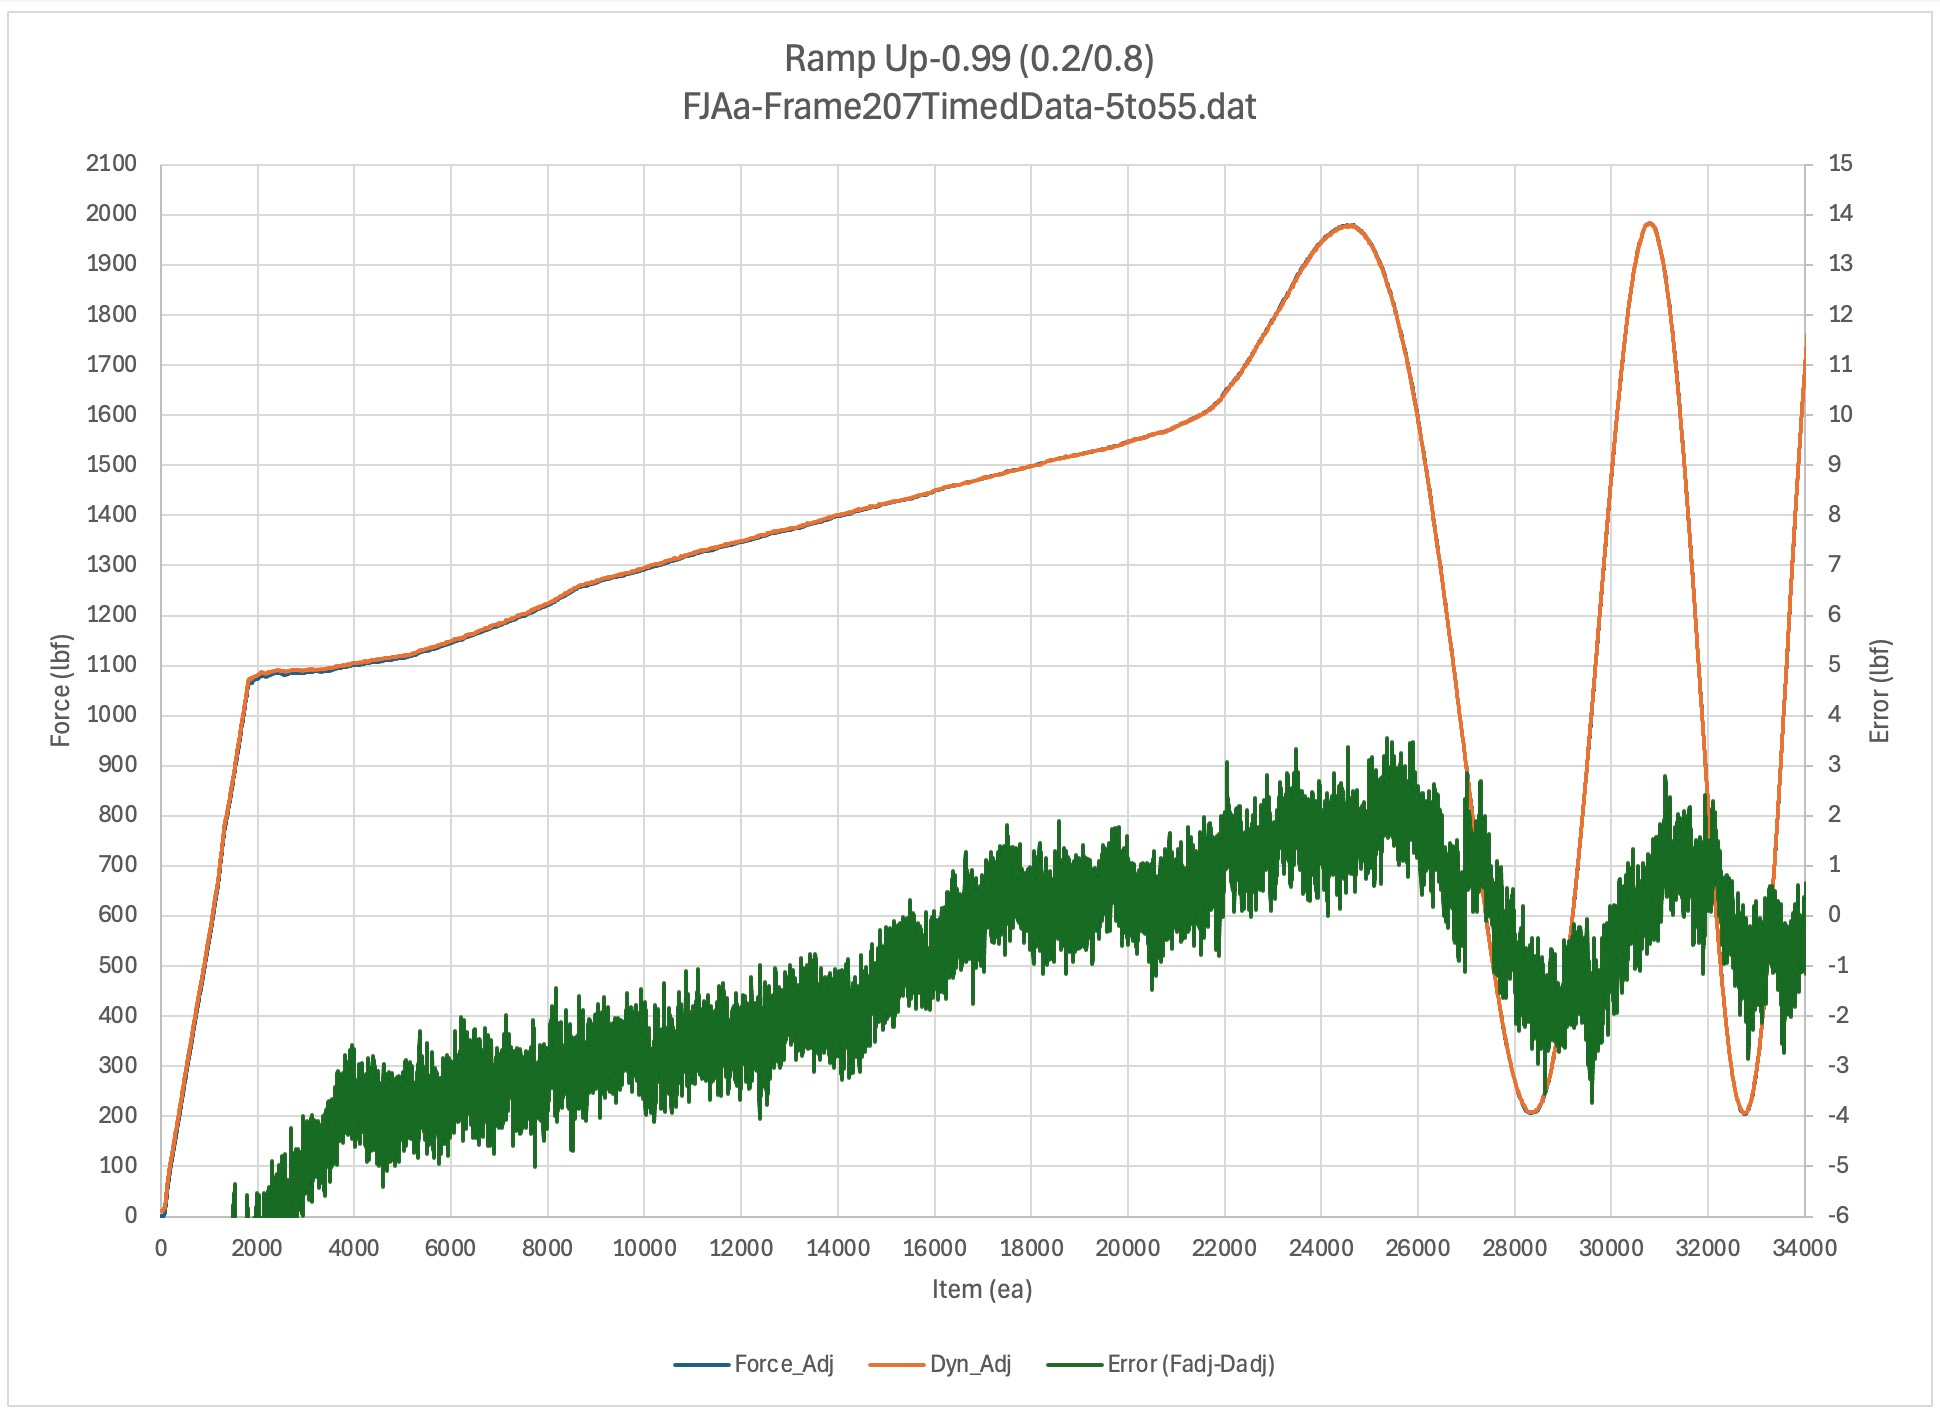
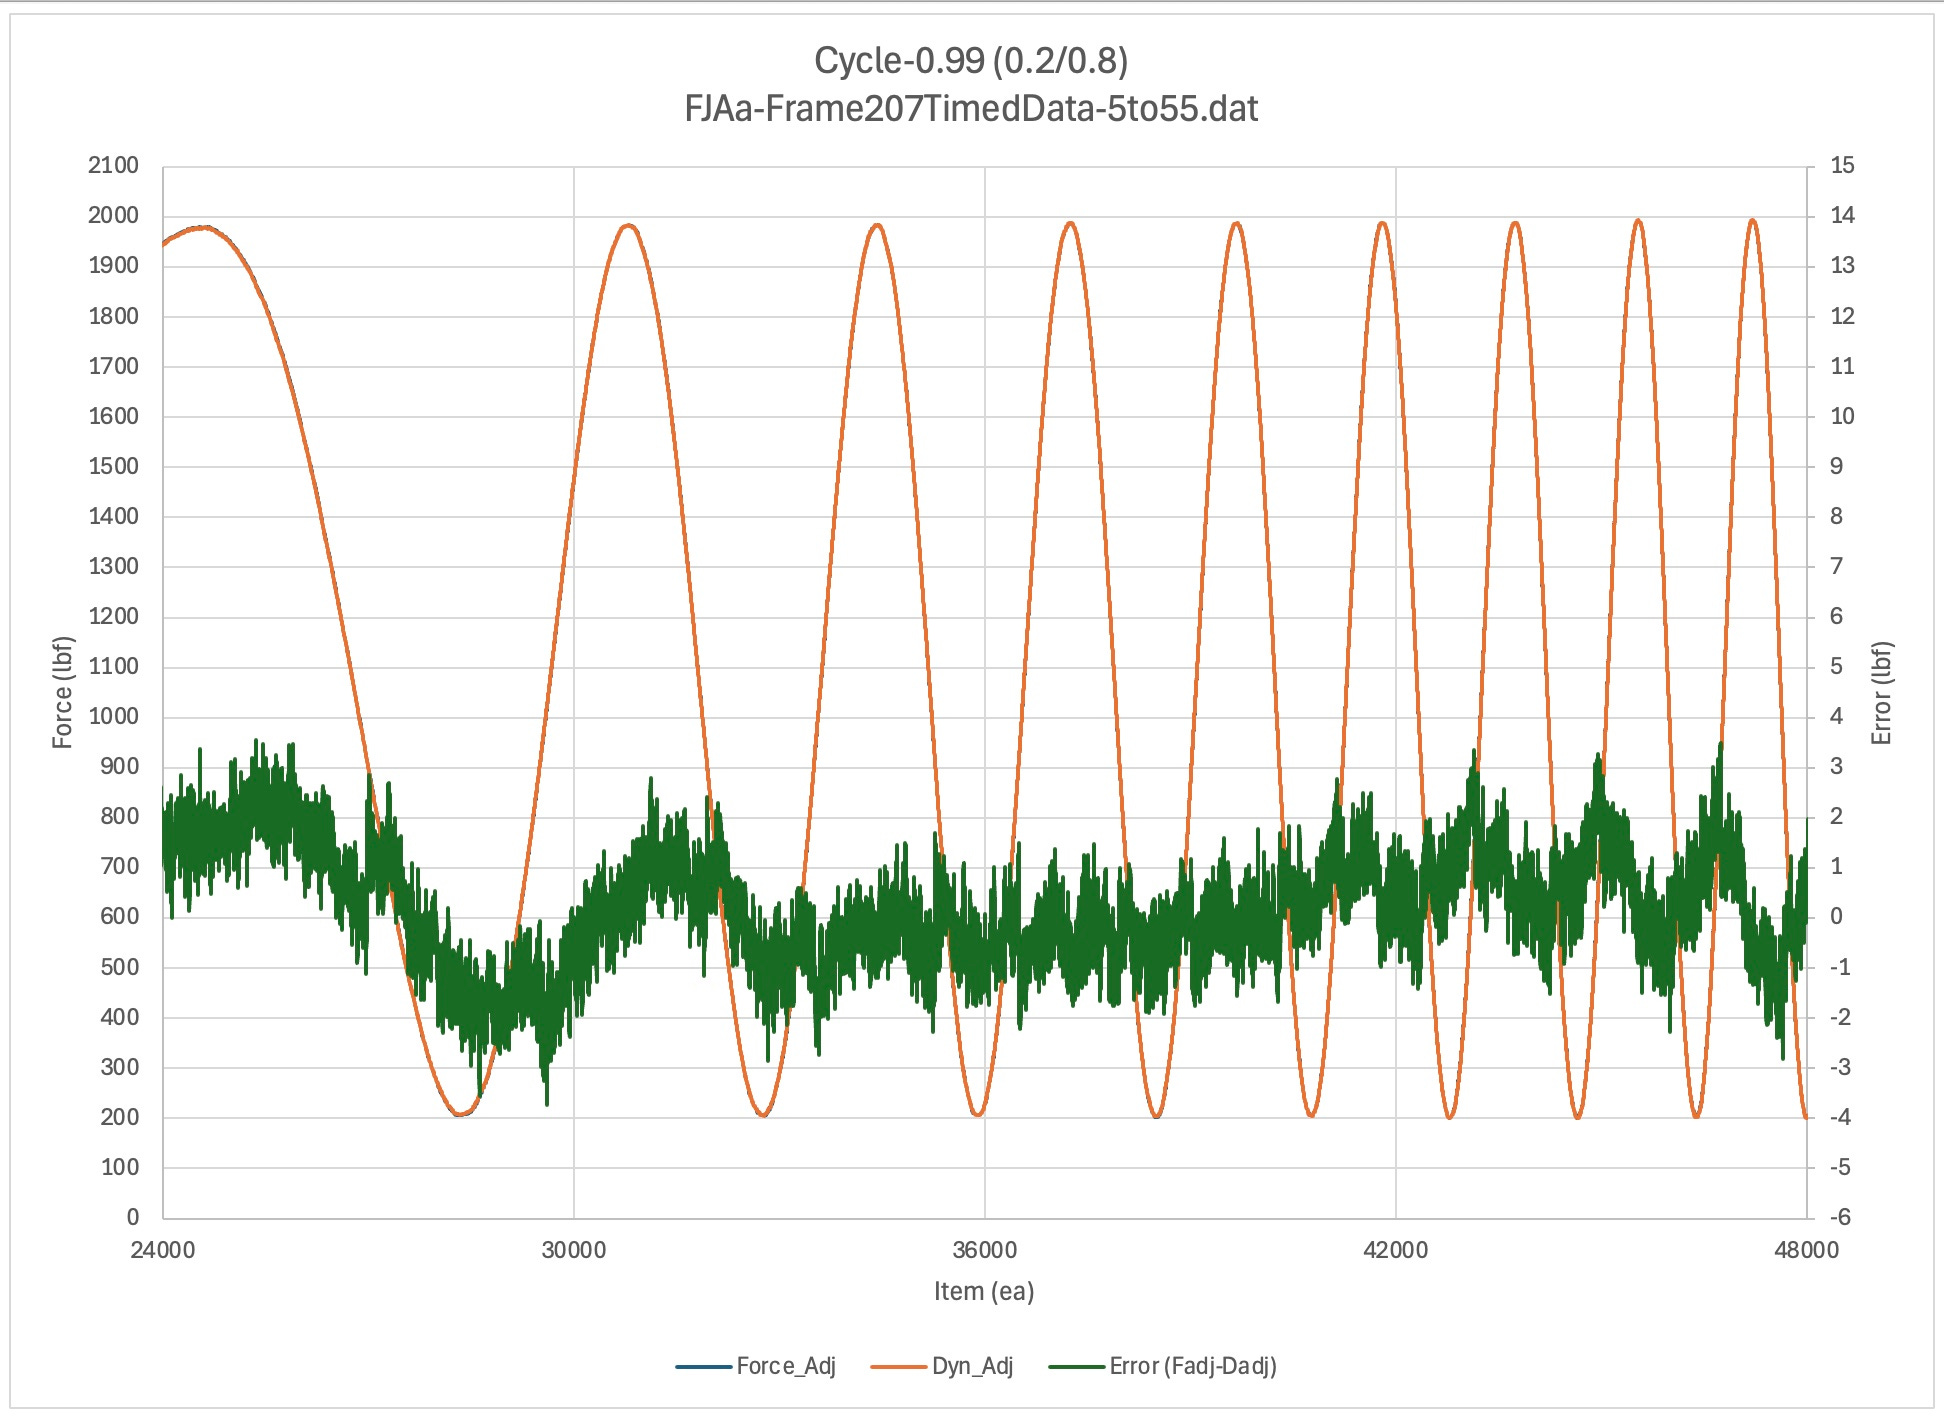
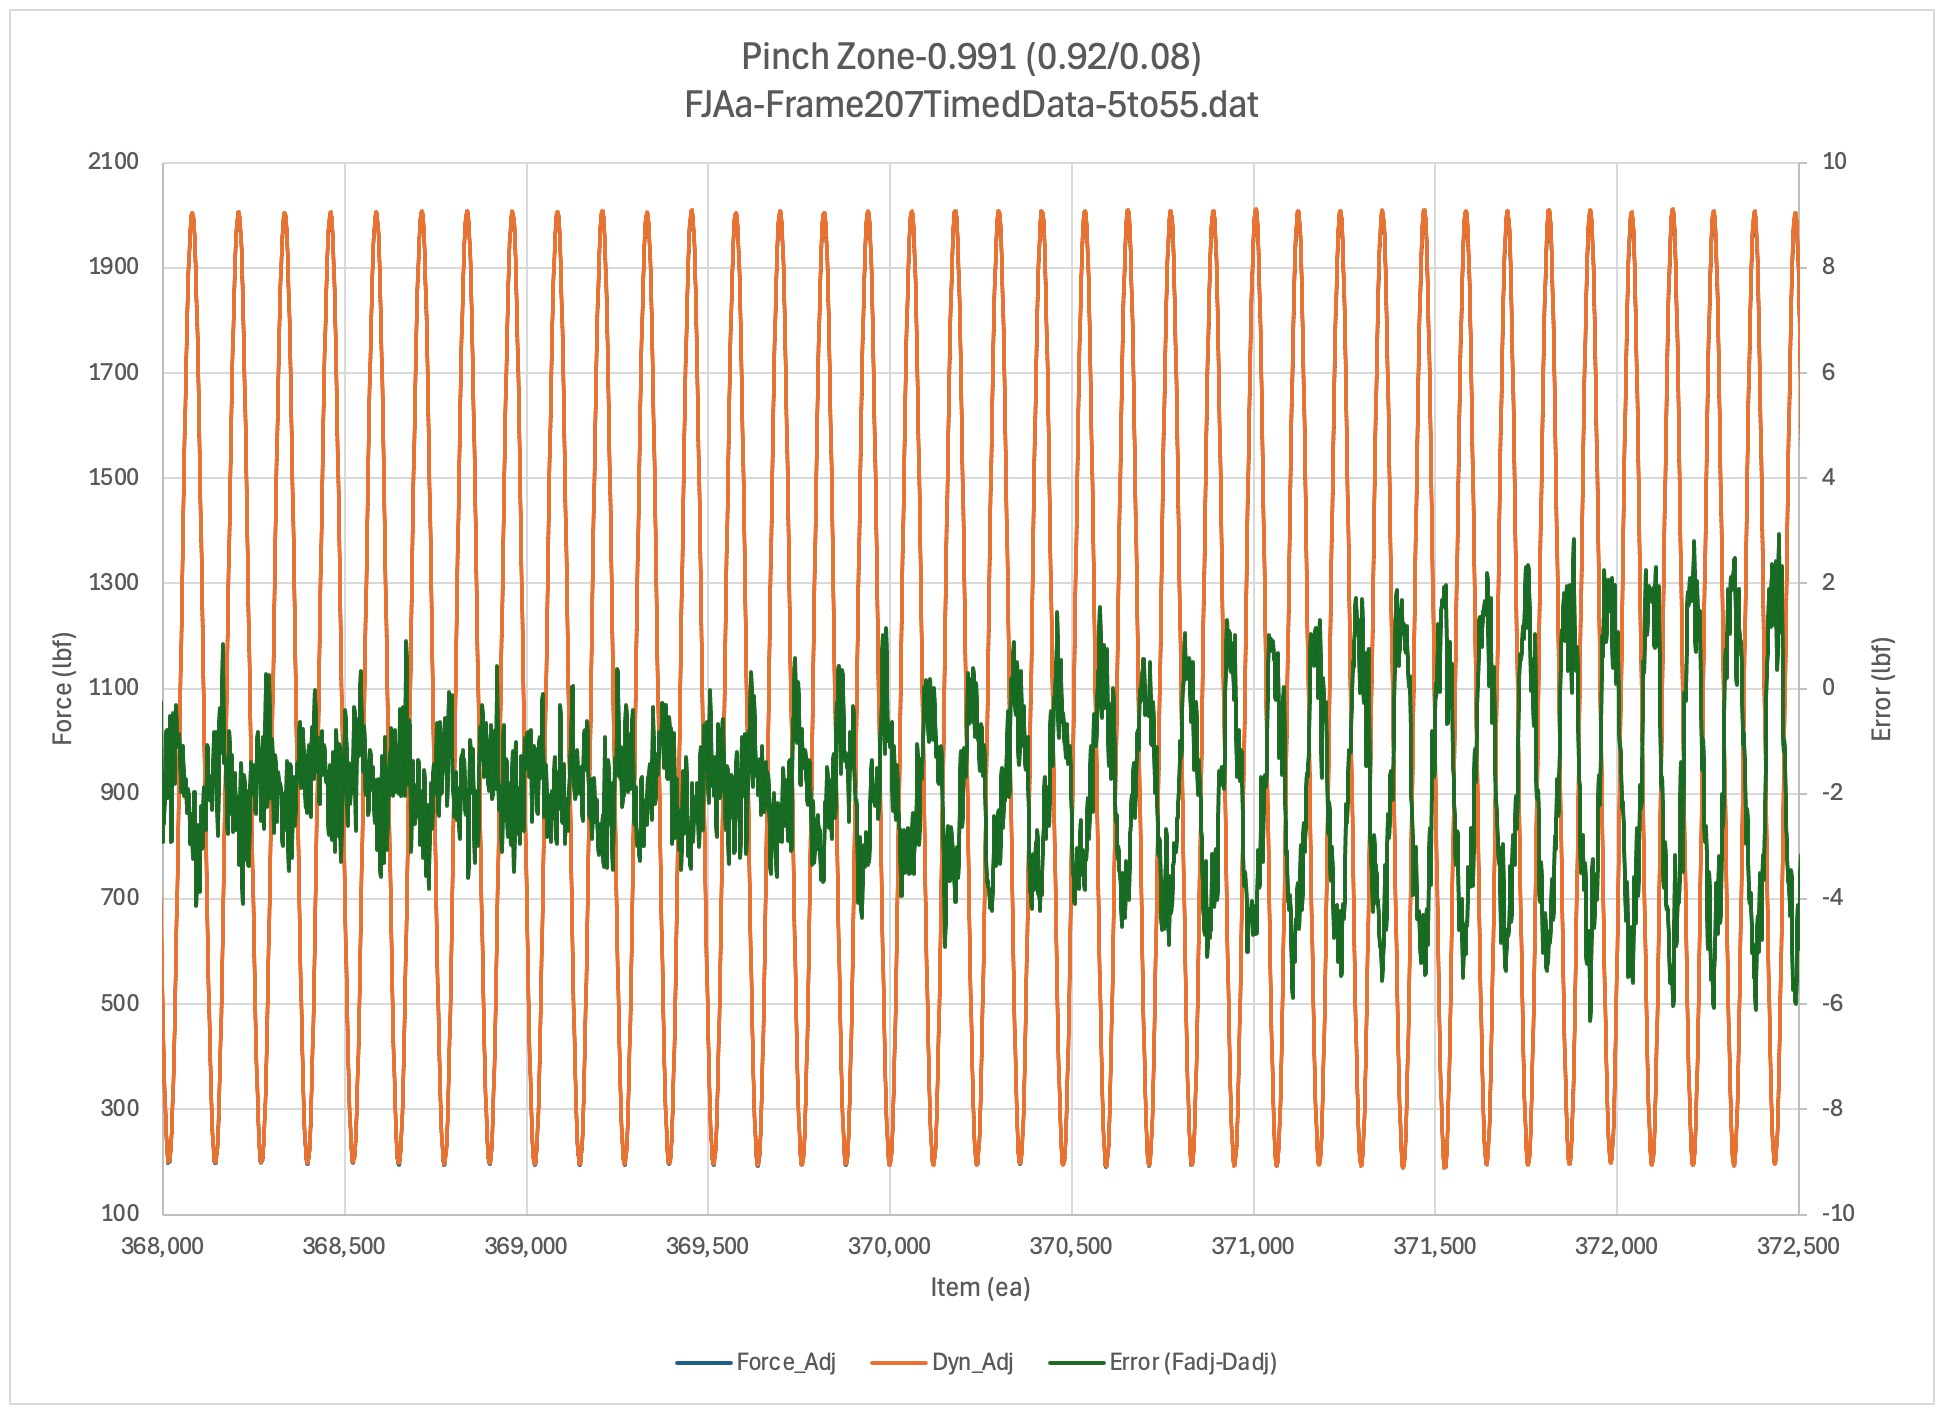
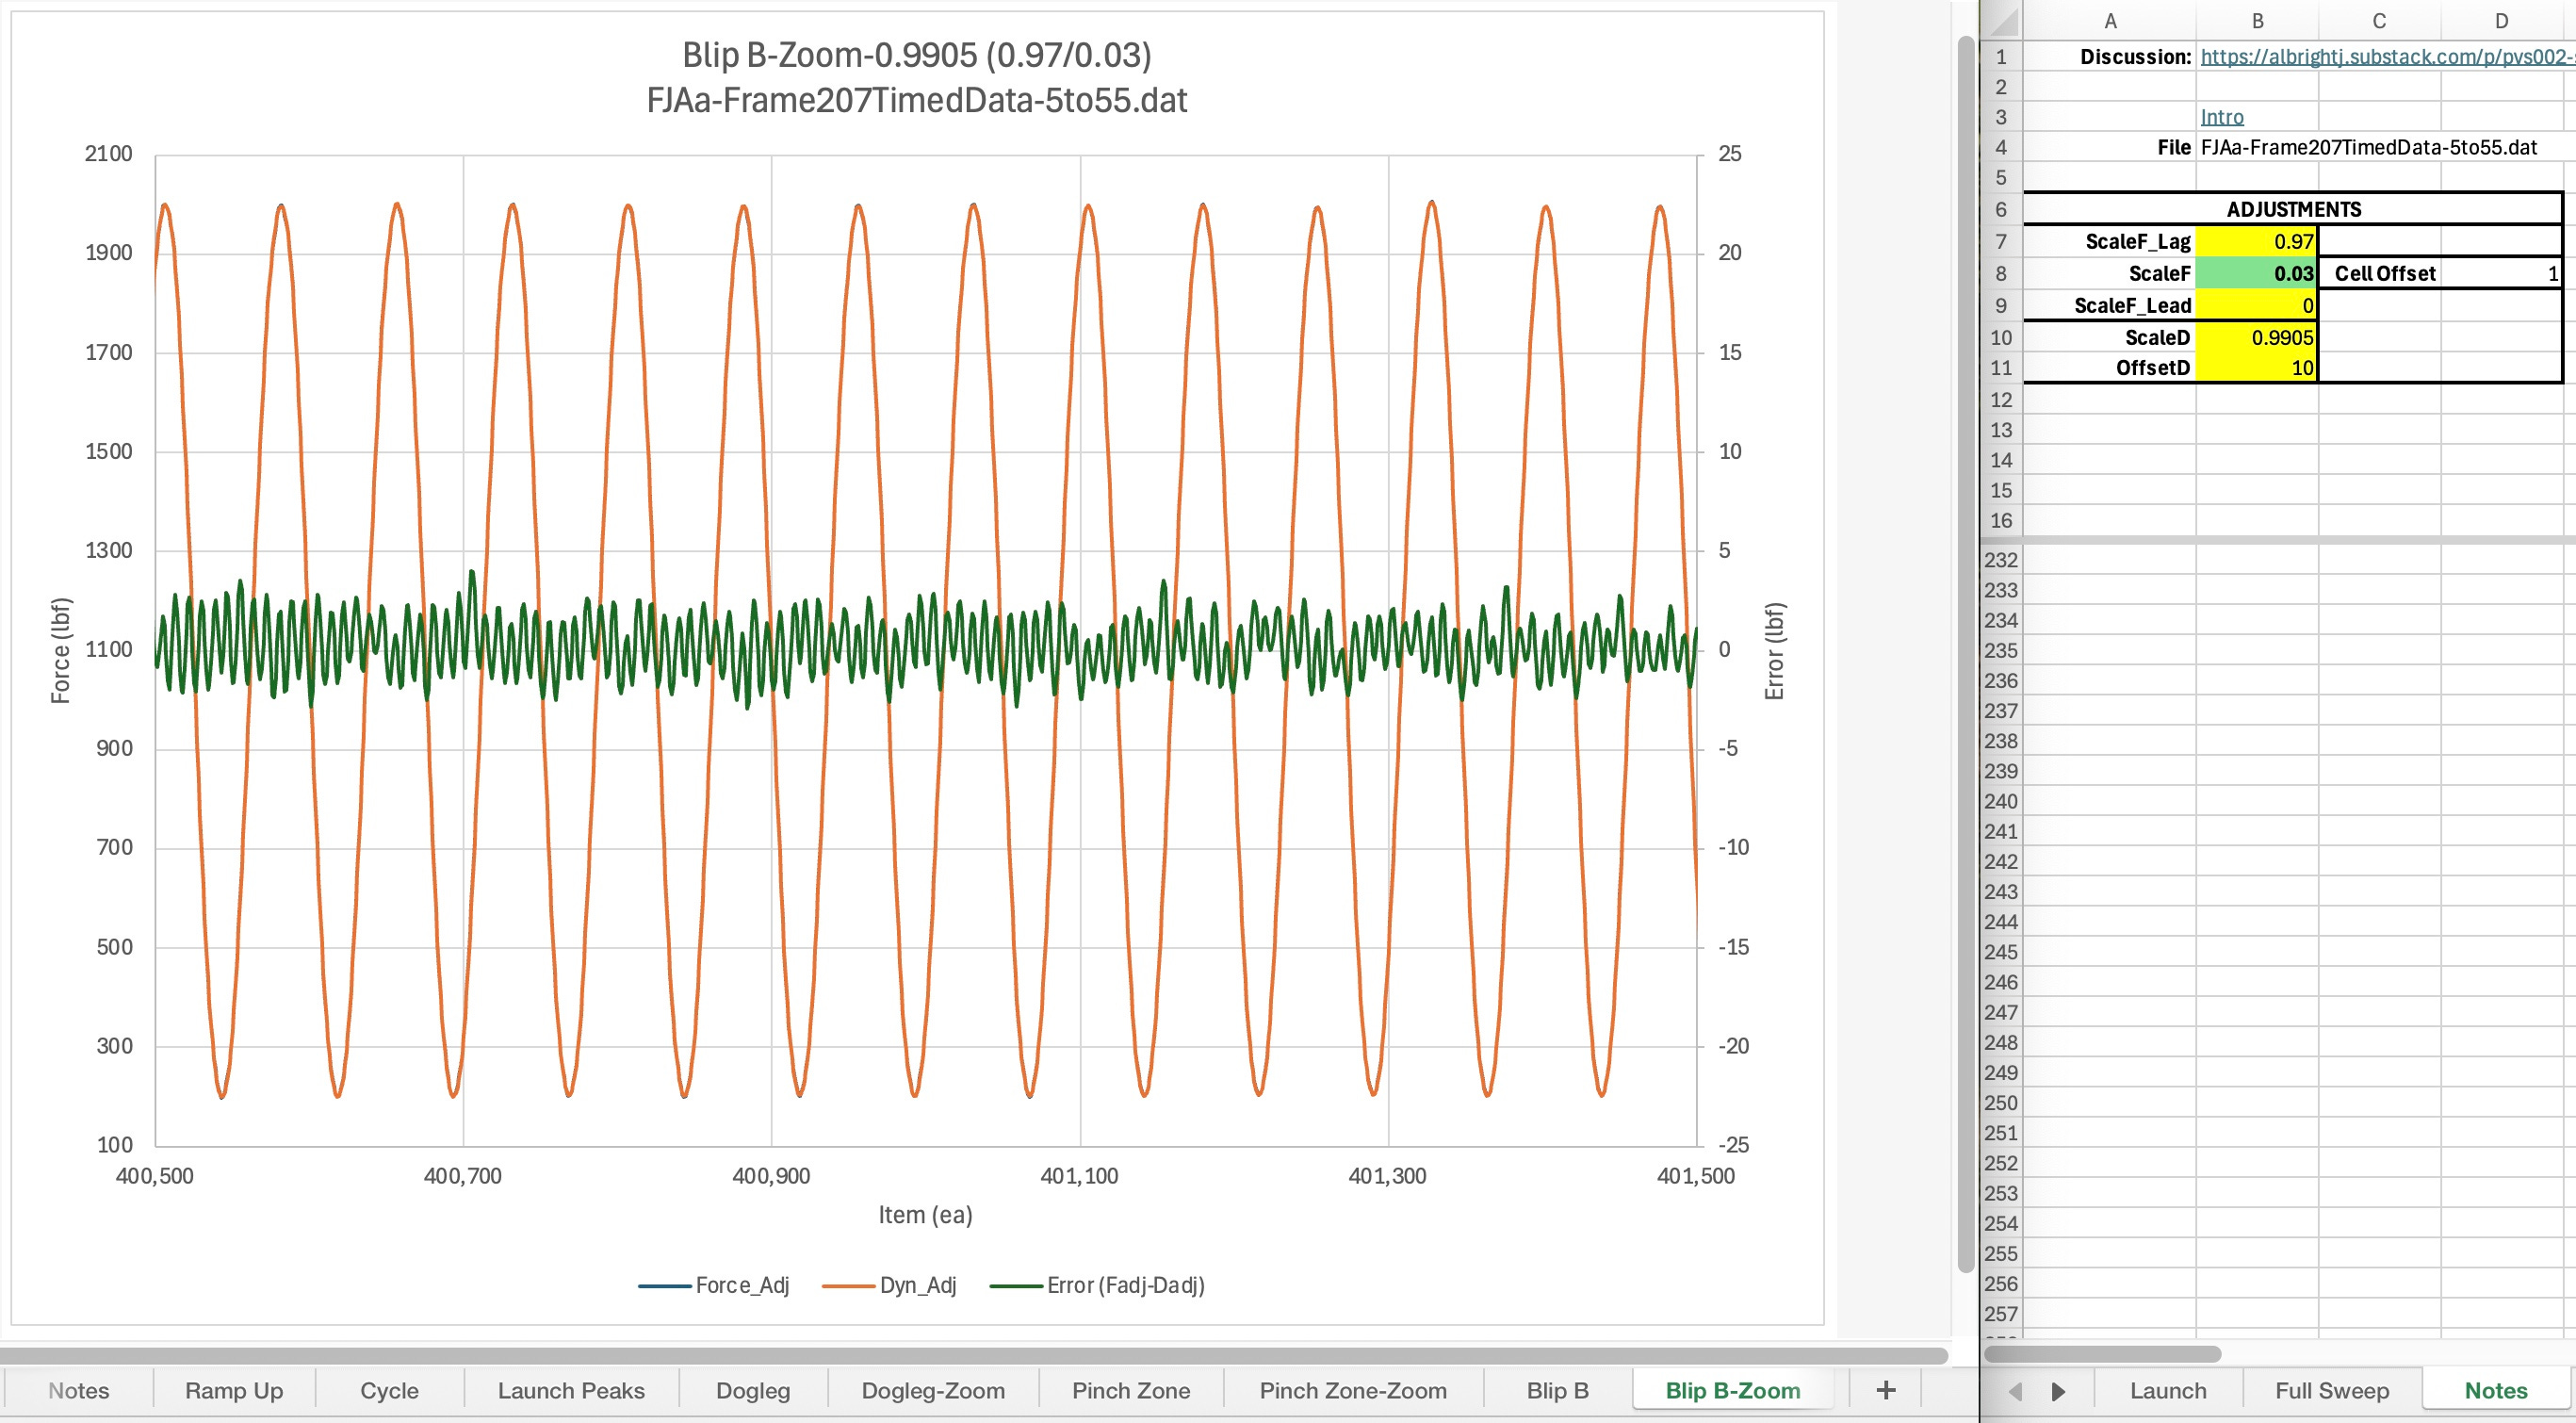
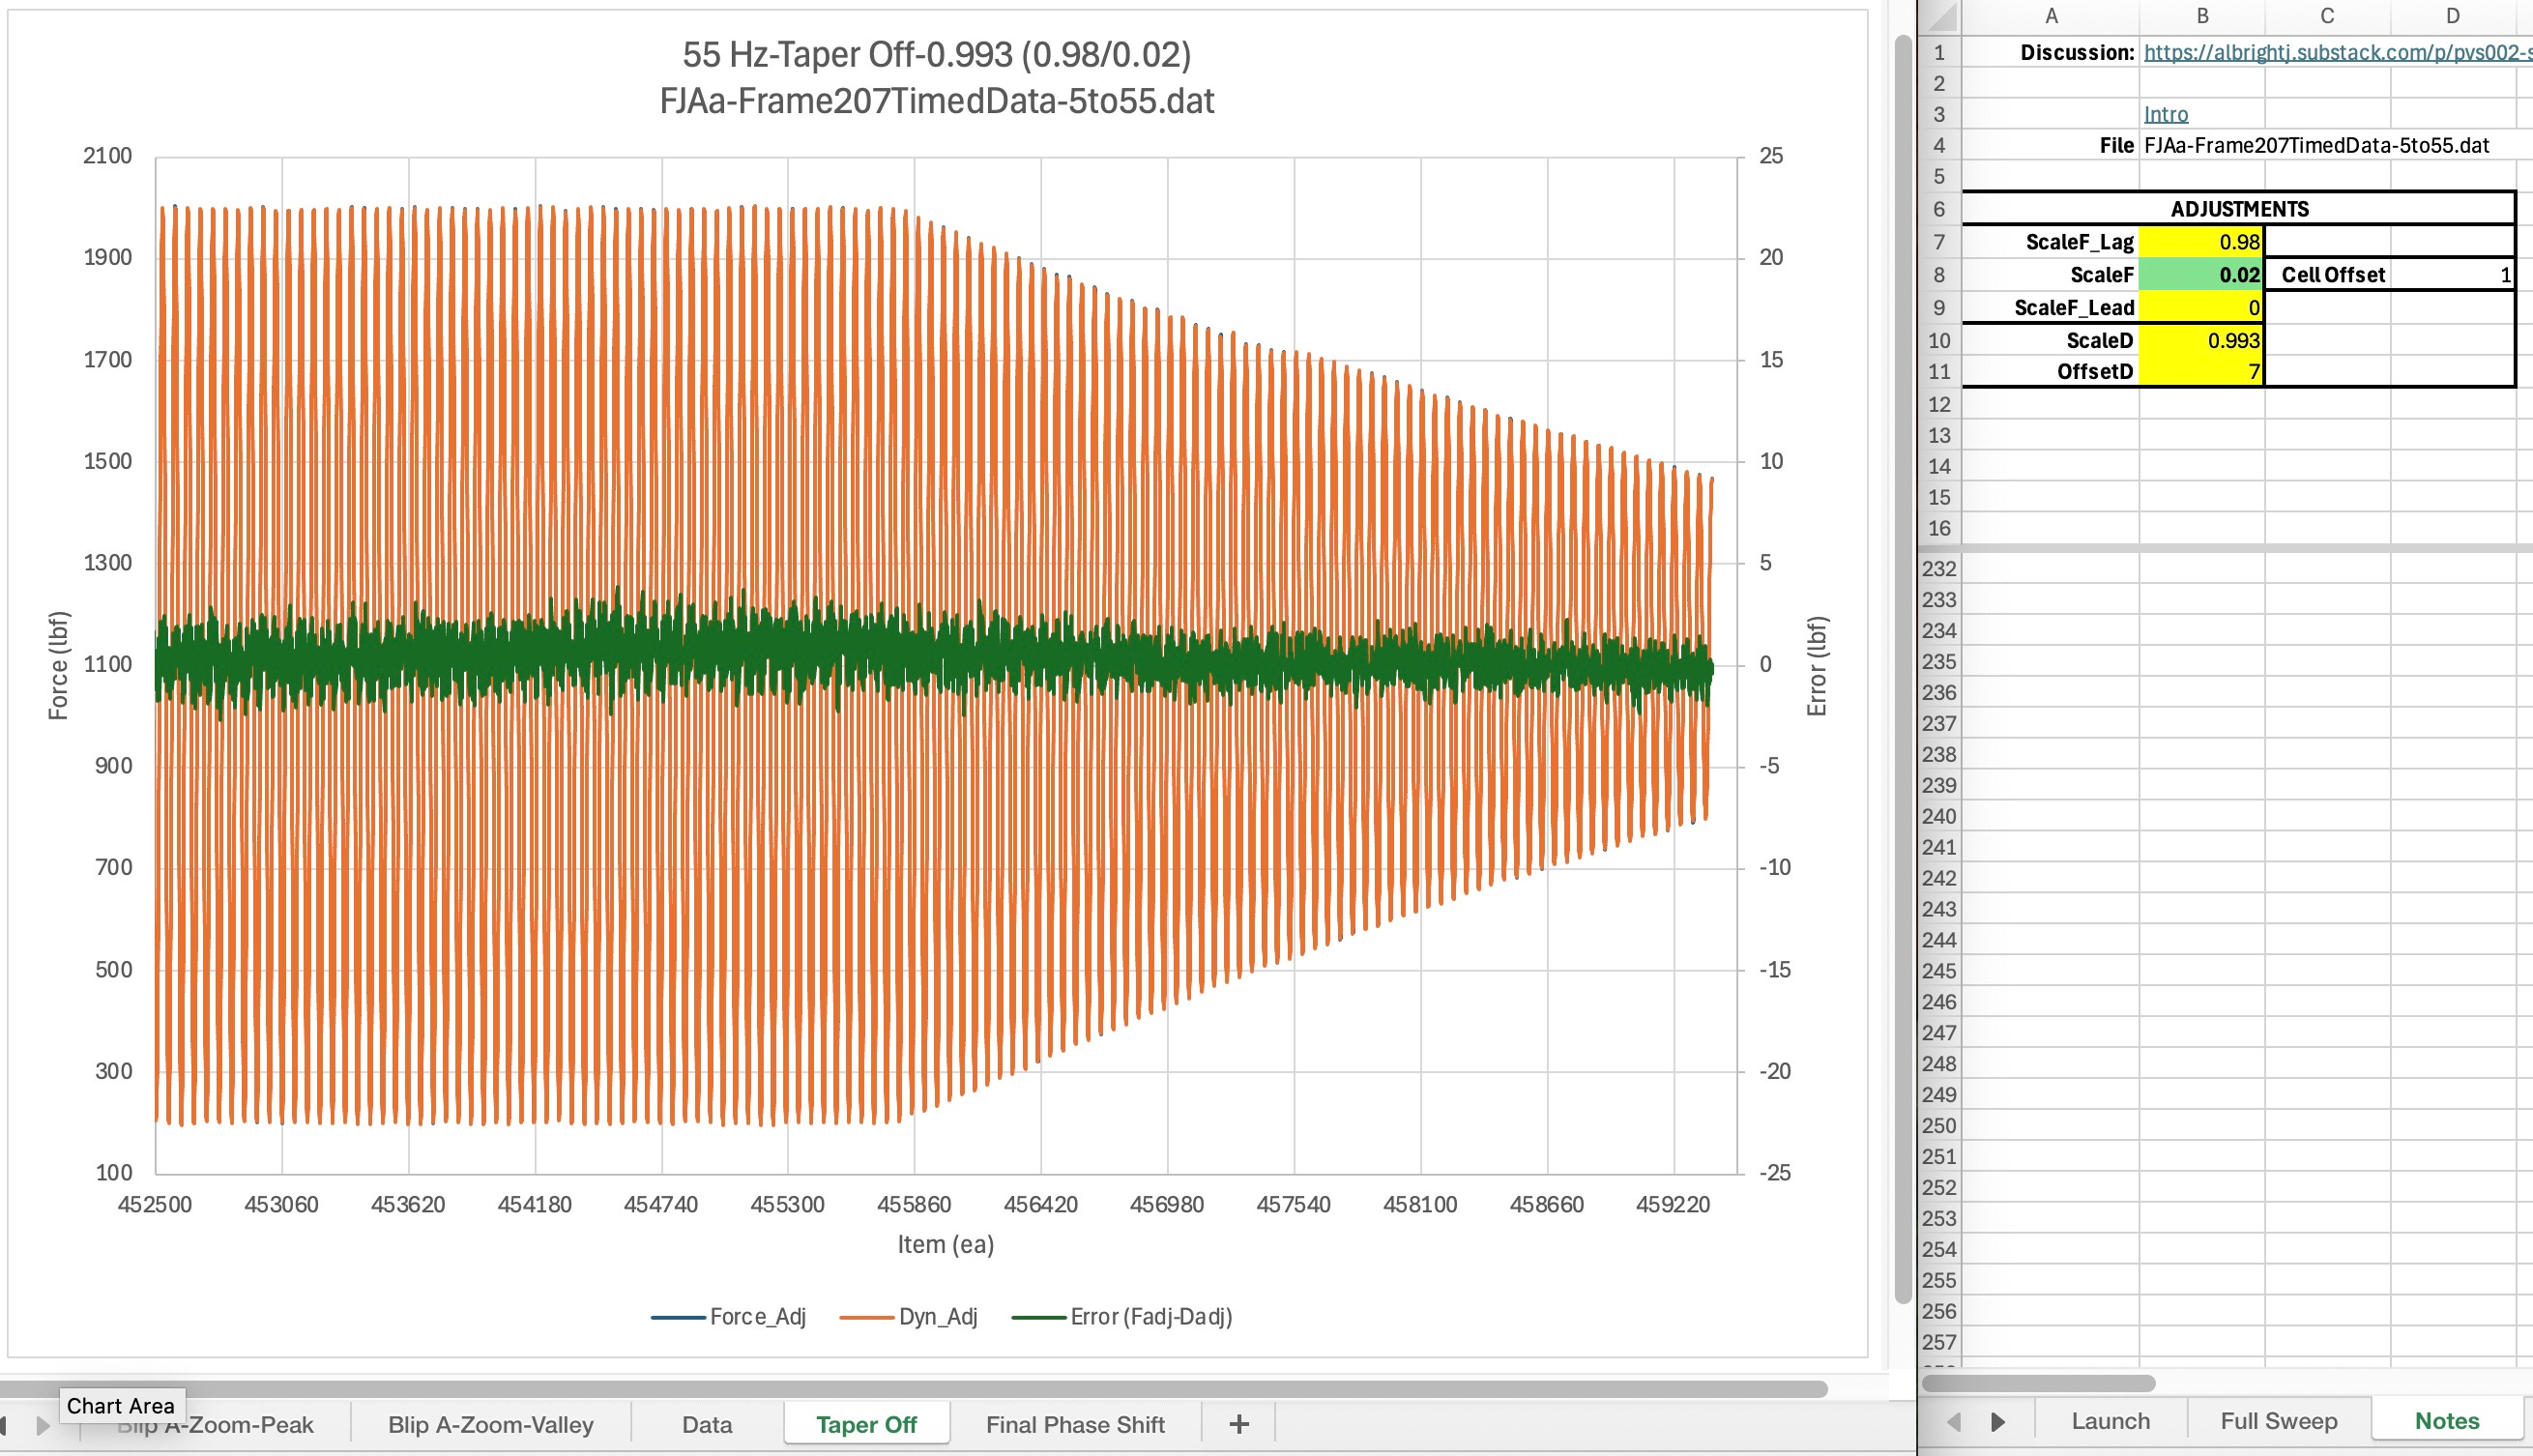
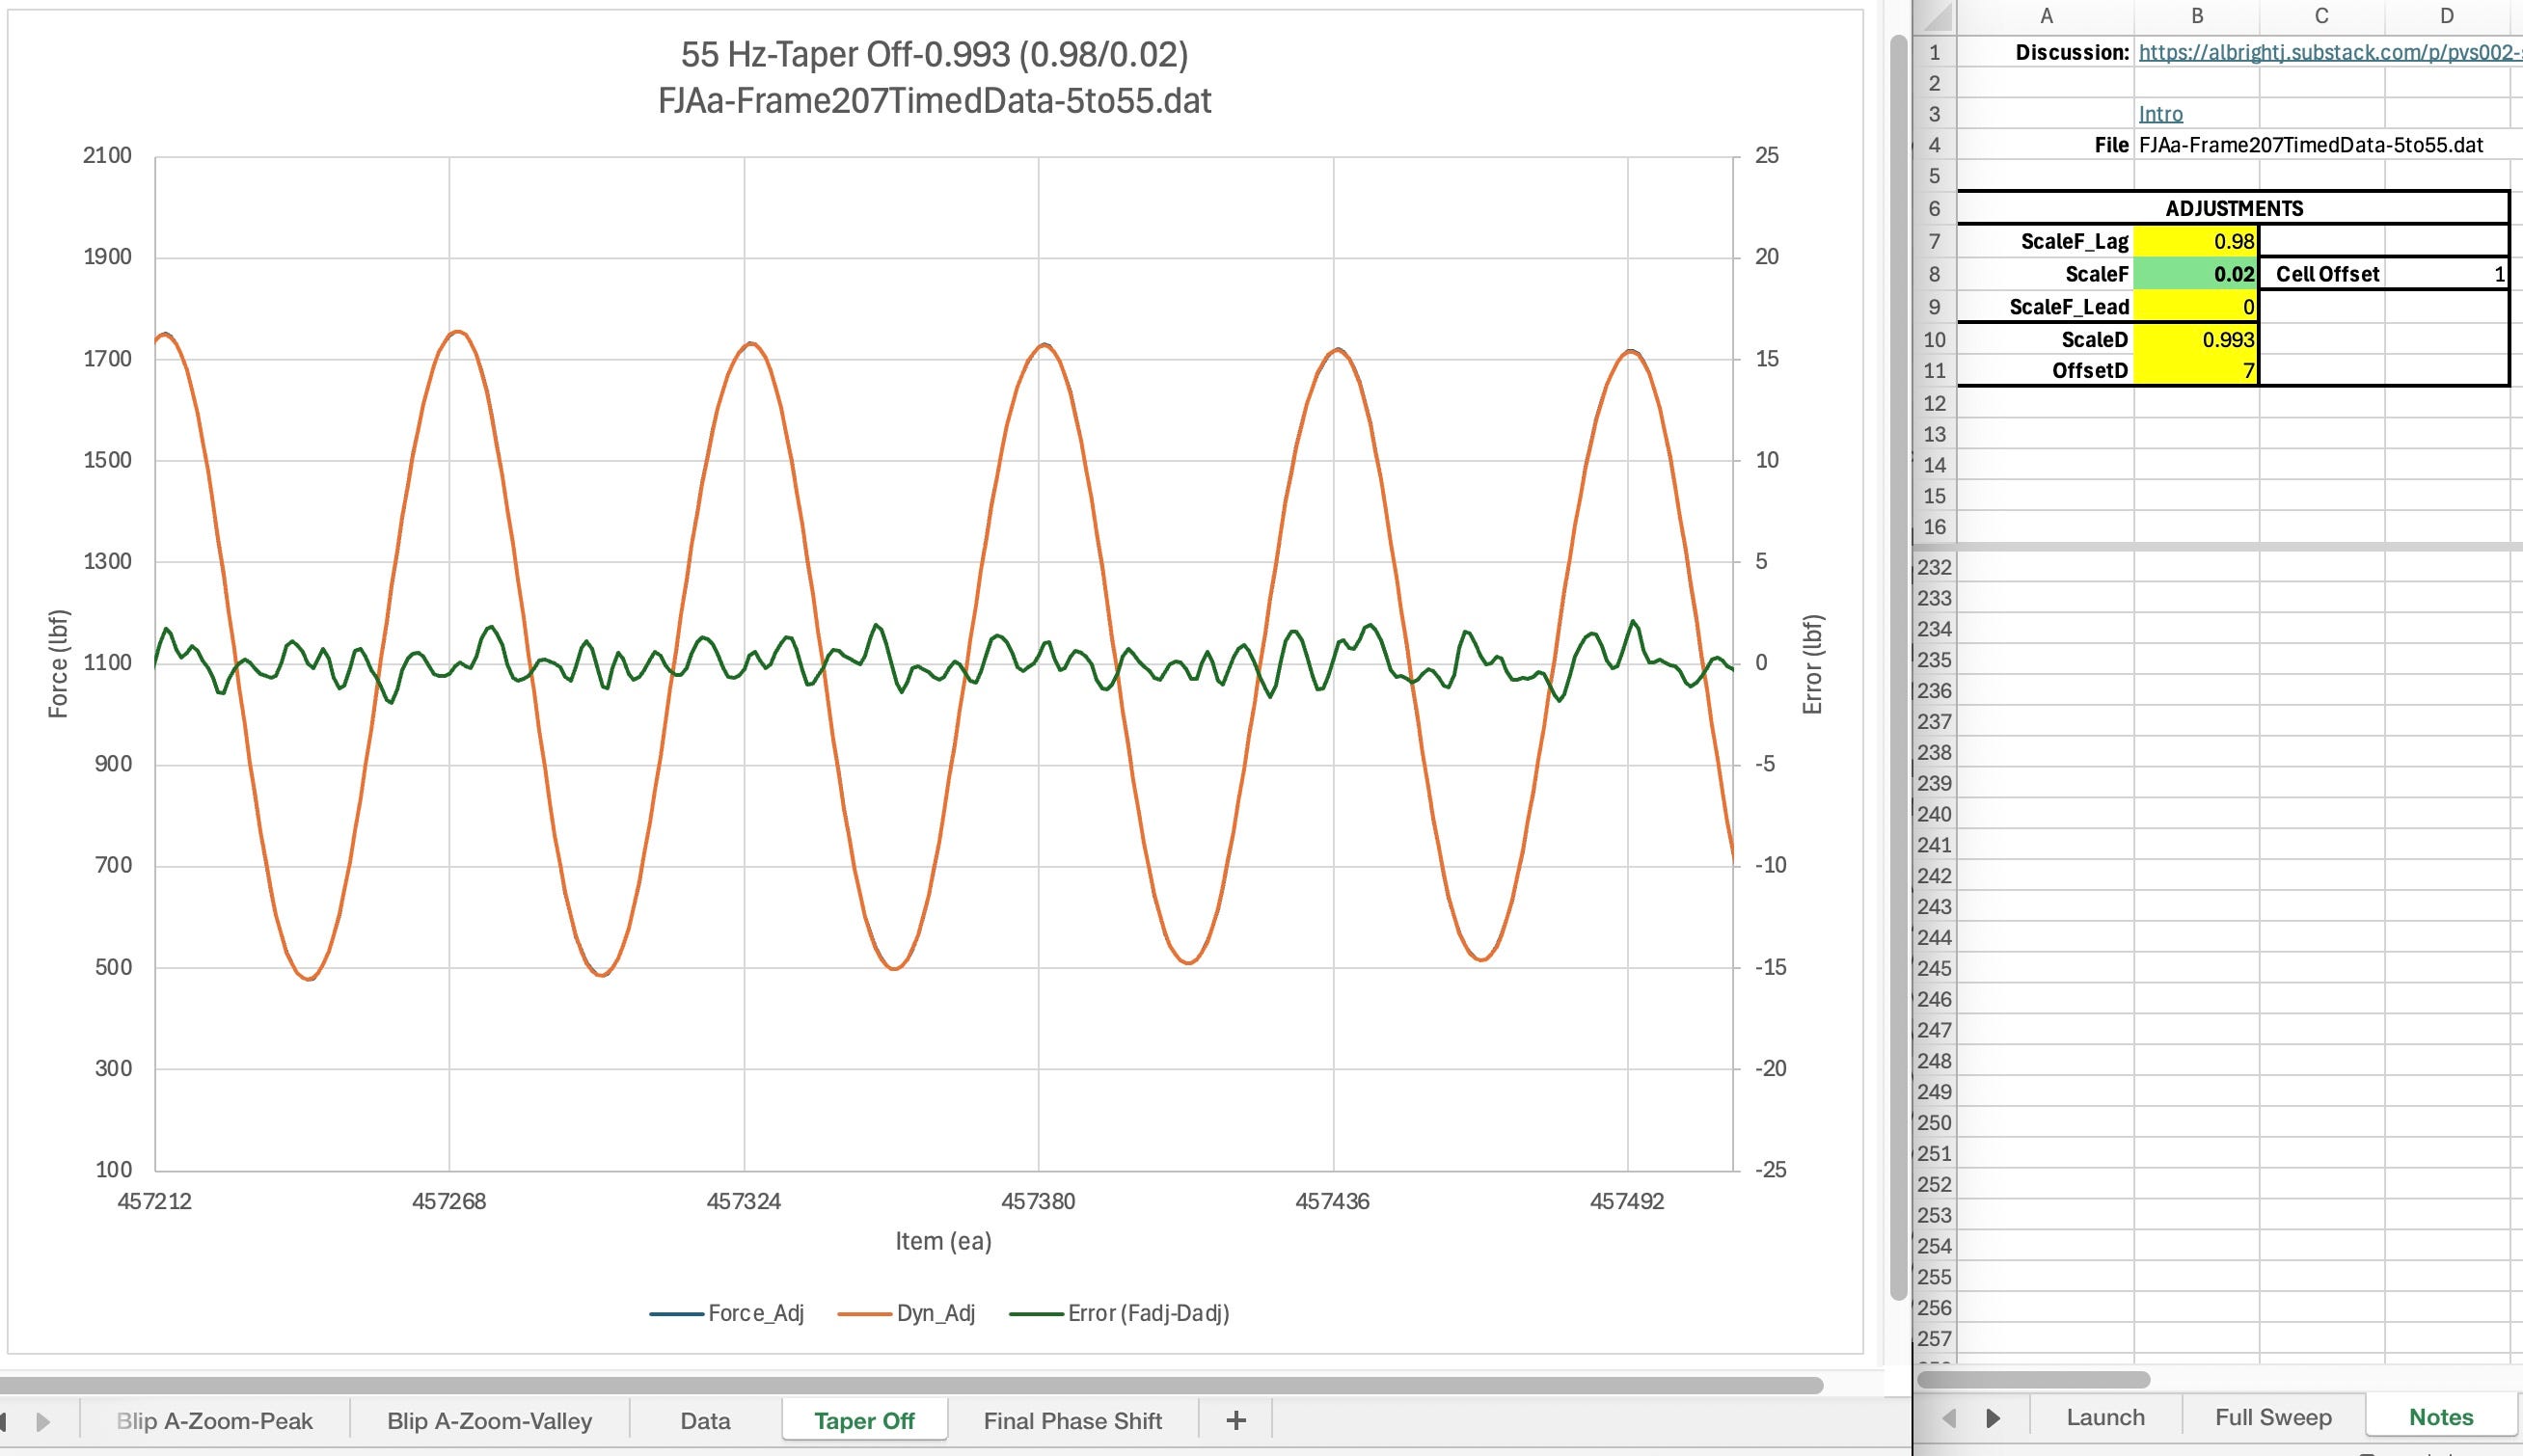
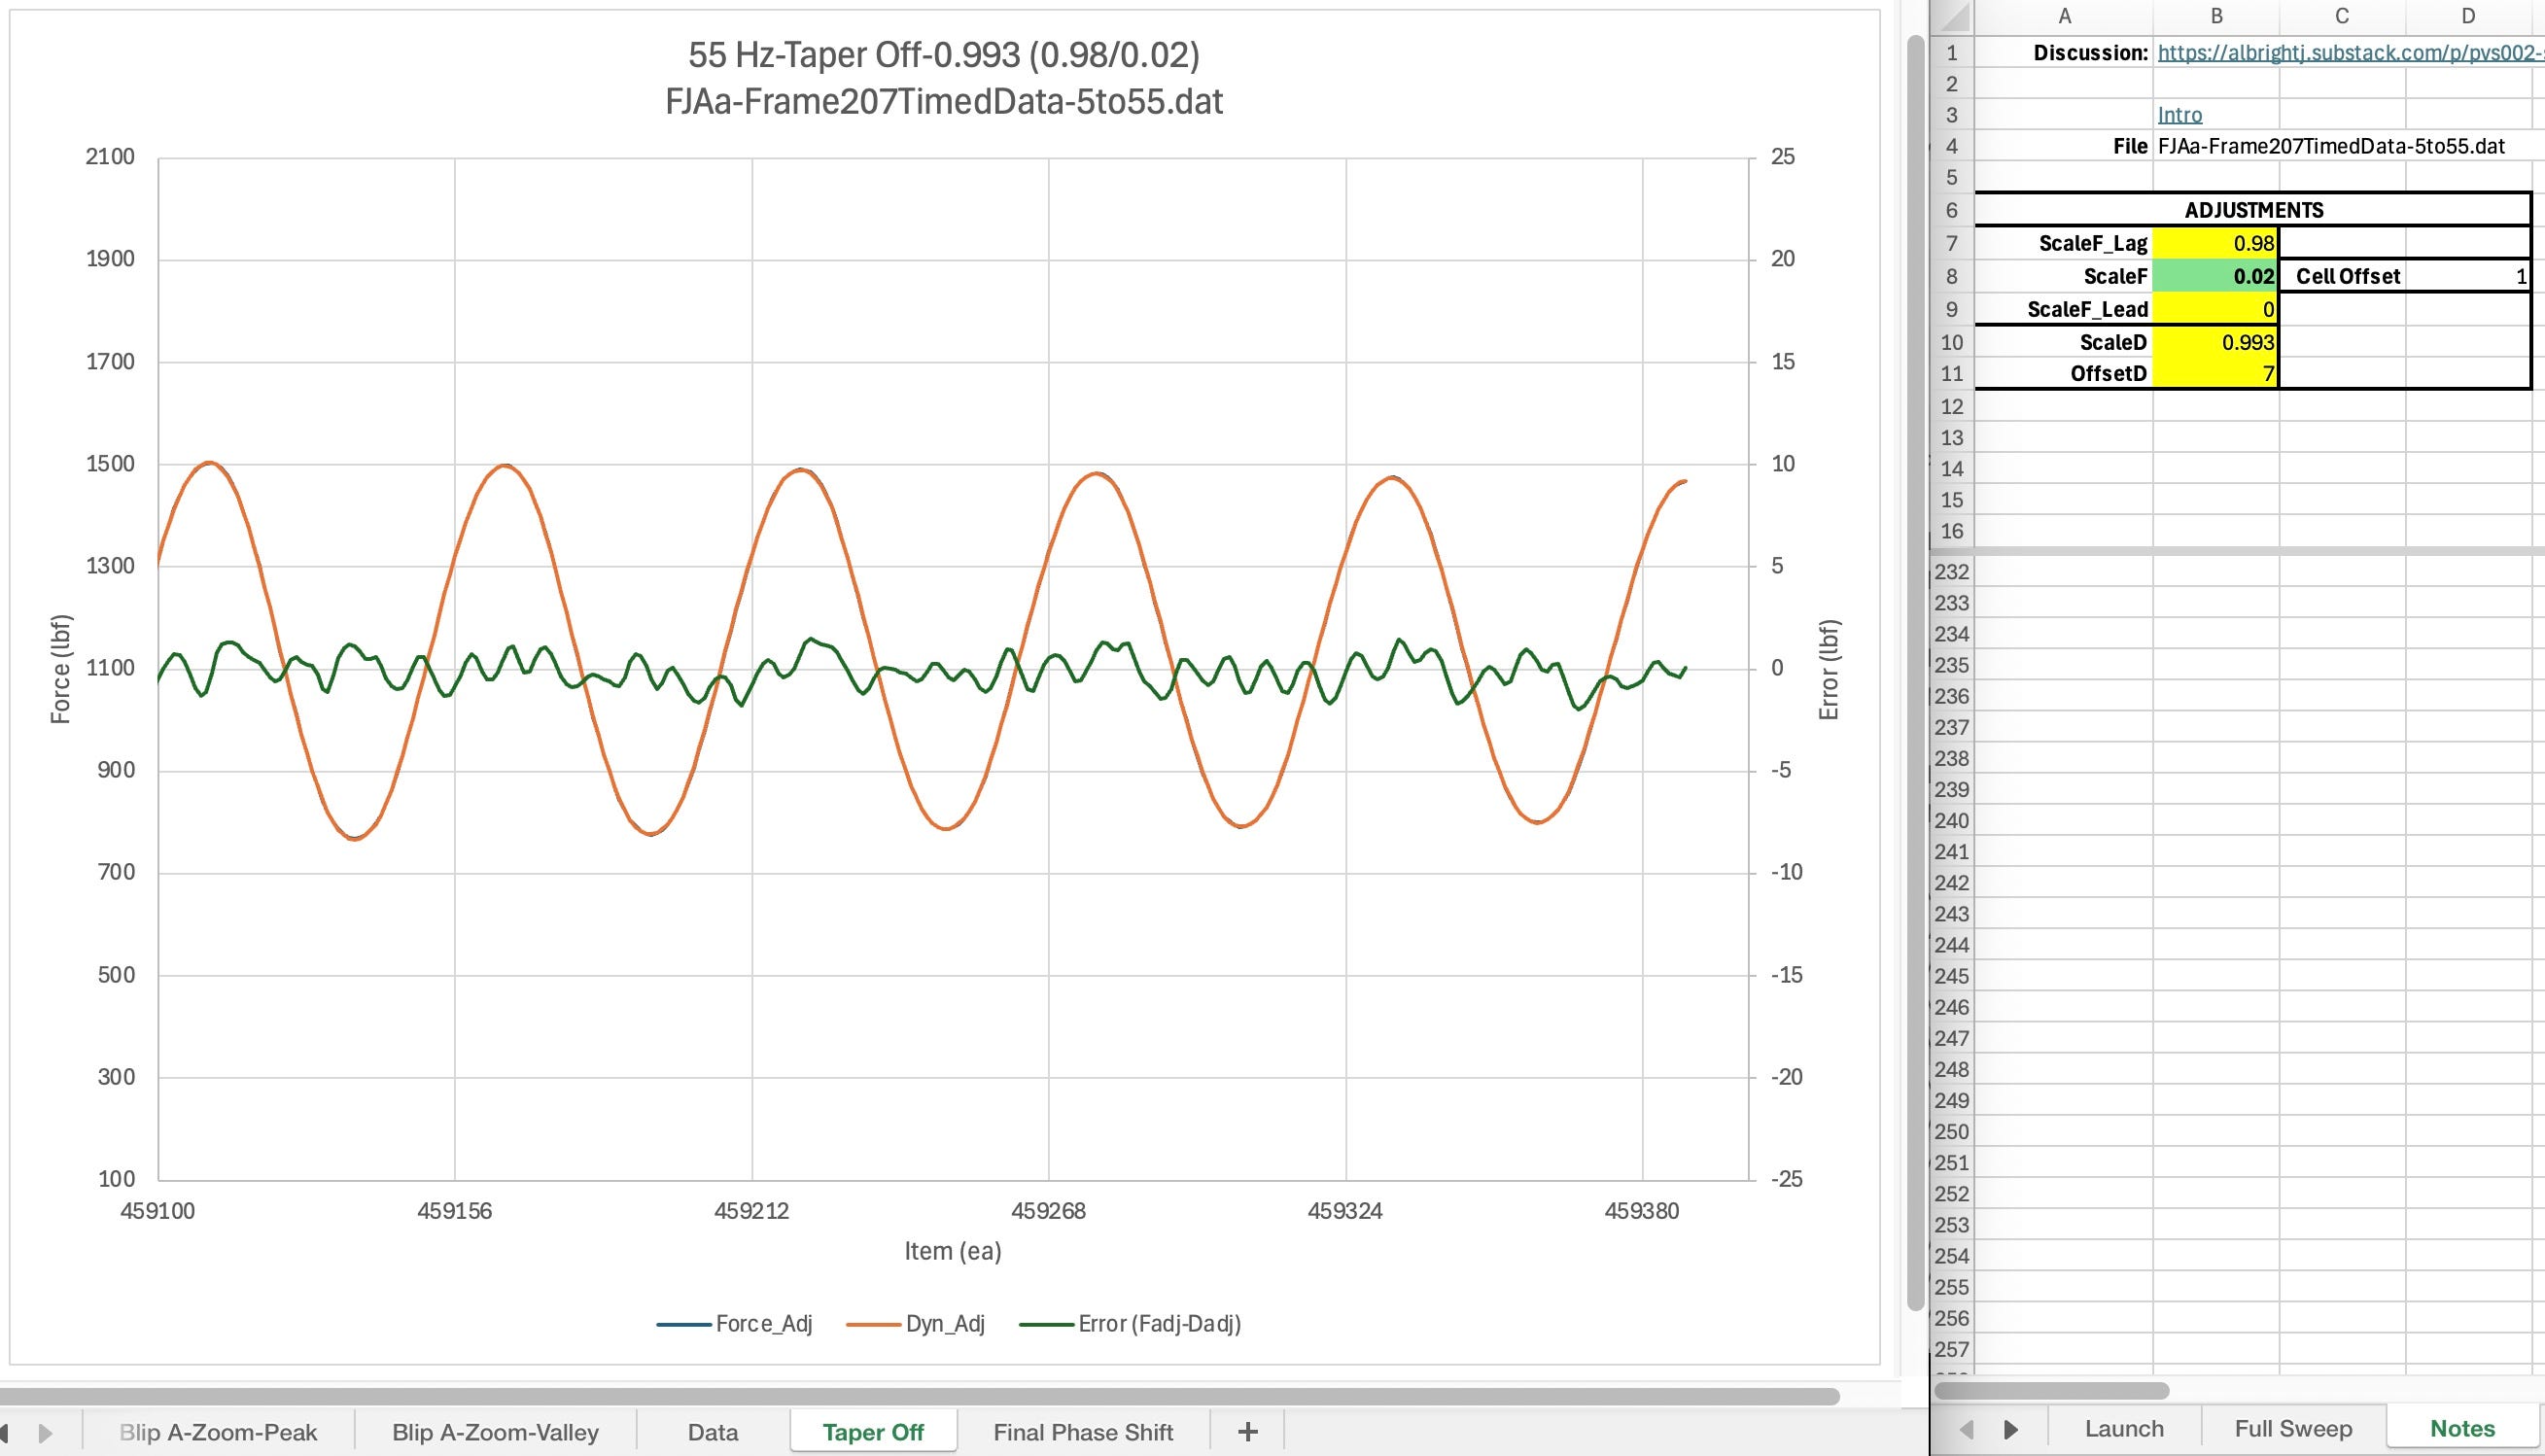
The figure below shows one view of the error band (green line) over the full time span of the sweep. It is Error (Fadj-Dadj) in the legend. A positive error is when the test machine’s load cell has a higher reading than the dynamometer.
The orange line is the dynamometer signal after adjustment for scale, and offset. It is signal Dyn_Adj in the legend. The test machine’s force cell, adjusted for phase, is the blue line. It is not apparent in this particular figure as it is completely covered by the dynamometer signal. It is signal Force_Adj in the legend.
The report is broken into major and minor sections. The major sections are:
Each major section will have a list of links points to that sections minor sections.
Proposed Process
This section gives a short outline of the overall process. Each step links to a Substack comment thread with the title Notes. If additional information has been added to a specific Note, there will be an (*) after the word Notes to let you know there is content to use. Until that time the link simply serves as your avenue to reach the place where you can add a comment/question.
Collect data (sine sweep) (Notes - N149811588)
Integrate with FJAa-SineSweep_Trainer-mini (Notes - N149811290)
Compute Full Error (Fadj-Dadj) (Notes - N149810991)
Plot Full Error signal (i.e. the green line) (Notes - N149810674)
Select target region (i.e. little black box) (Notes - N149810173)
May require item to frequency conversion
Adjust phasing, and dyno cal (scale and offset) for minimum error (Notes - N149809805)
Check dyno scale adjustment vs max allowable error (Notes - N149809455)
Proceed with test if in spec, do ??? if not in spec (Notes - N149808798)
The workbooks used with this post are in the ASTM Collaboration Area 80292 files area for the Performance Studies. See the Sine Sweep Trainer section for an introduction to the structure of the workbooks and how to create a new one for a new sine sweep study.
Theory of Operation
Up / Comments / Figures-Regions , Outline
Refer to the comments section using the link above, just below the section title, to read about material that in the future will probably get added here. It will give you a good starting point for this section.
Motions
Up / Comments / Performance Curves
Discussion TBD
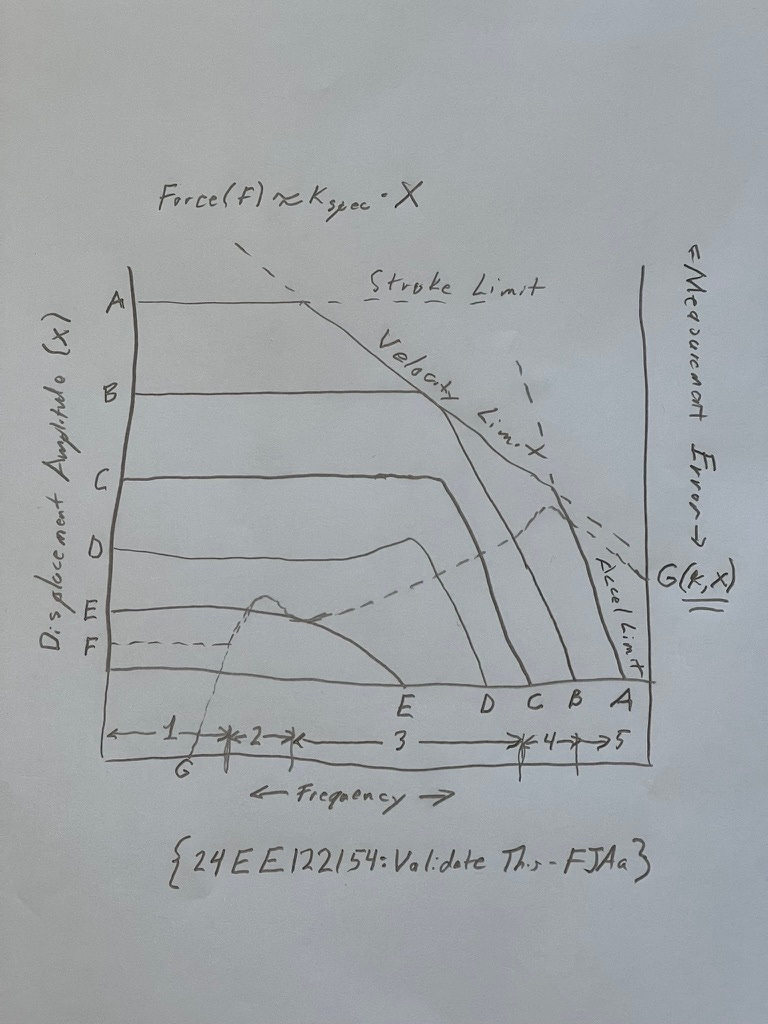
Performance Curves
Discussion TBD
Figures-Zoom
Up / Comments / Features and Methods , Outline
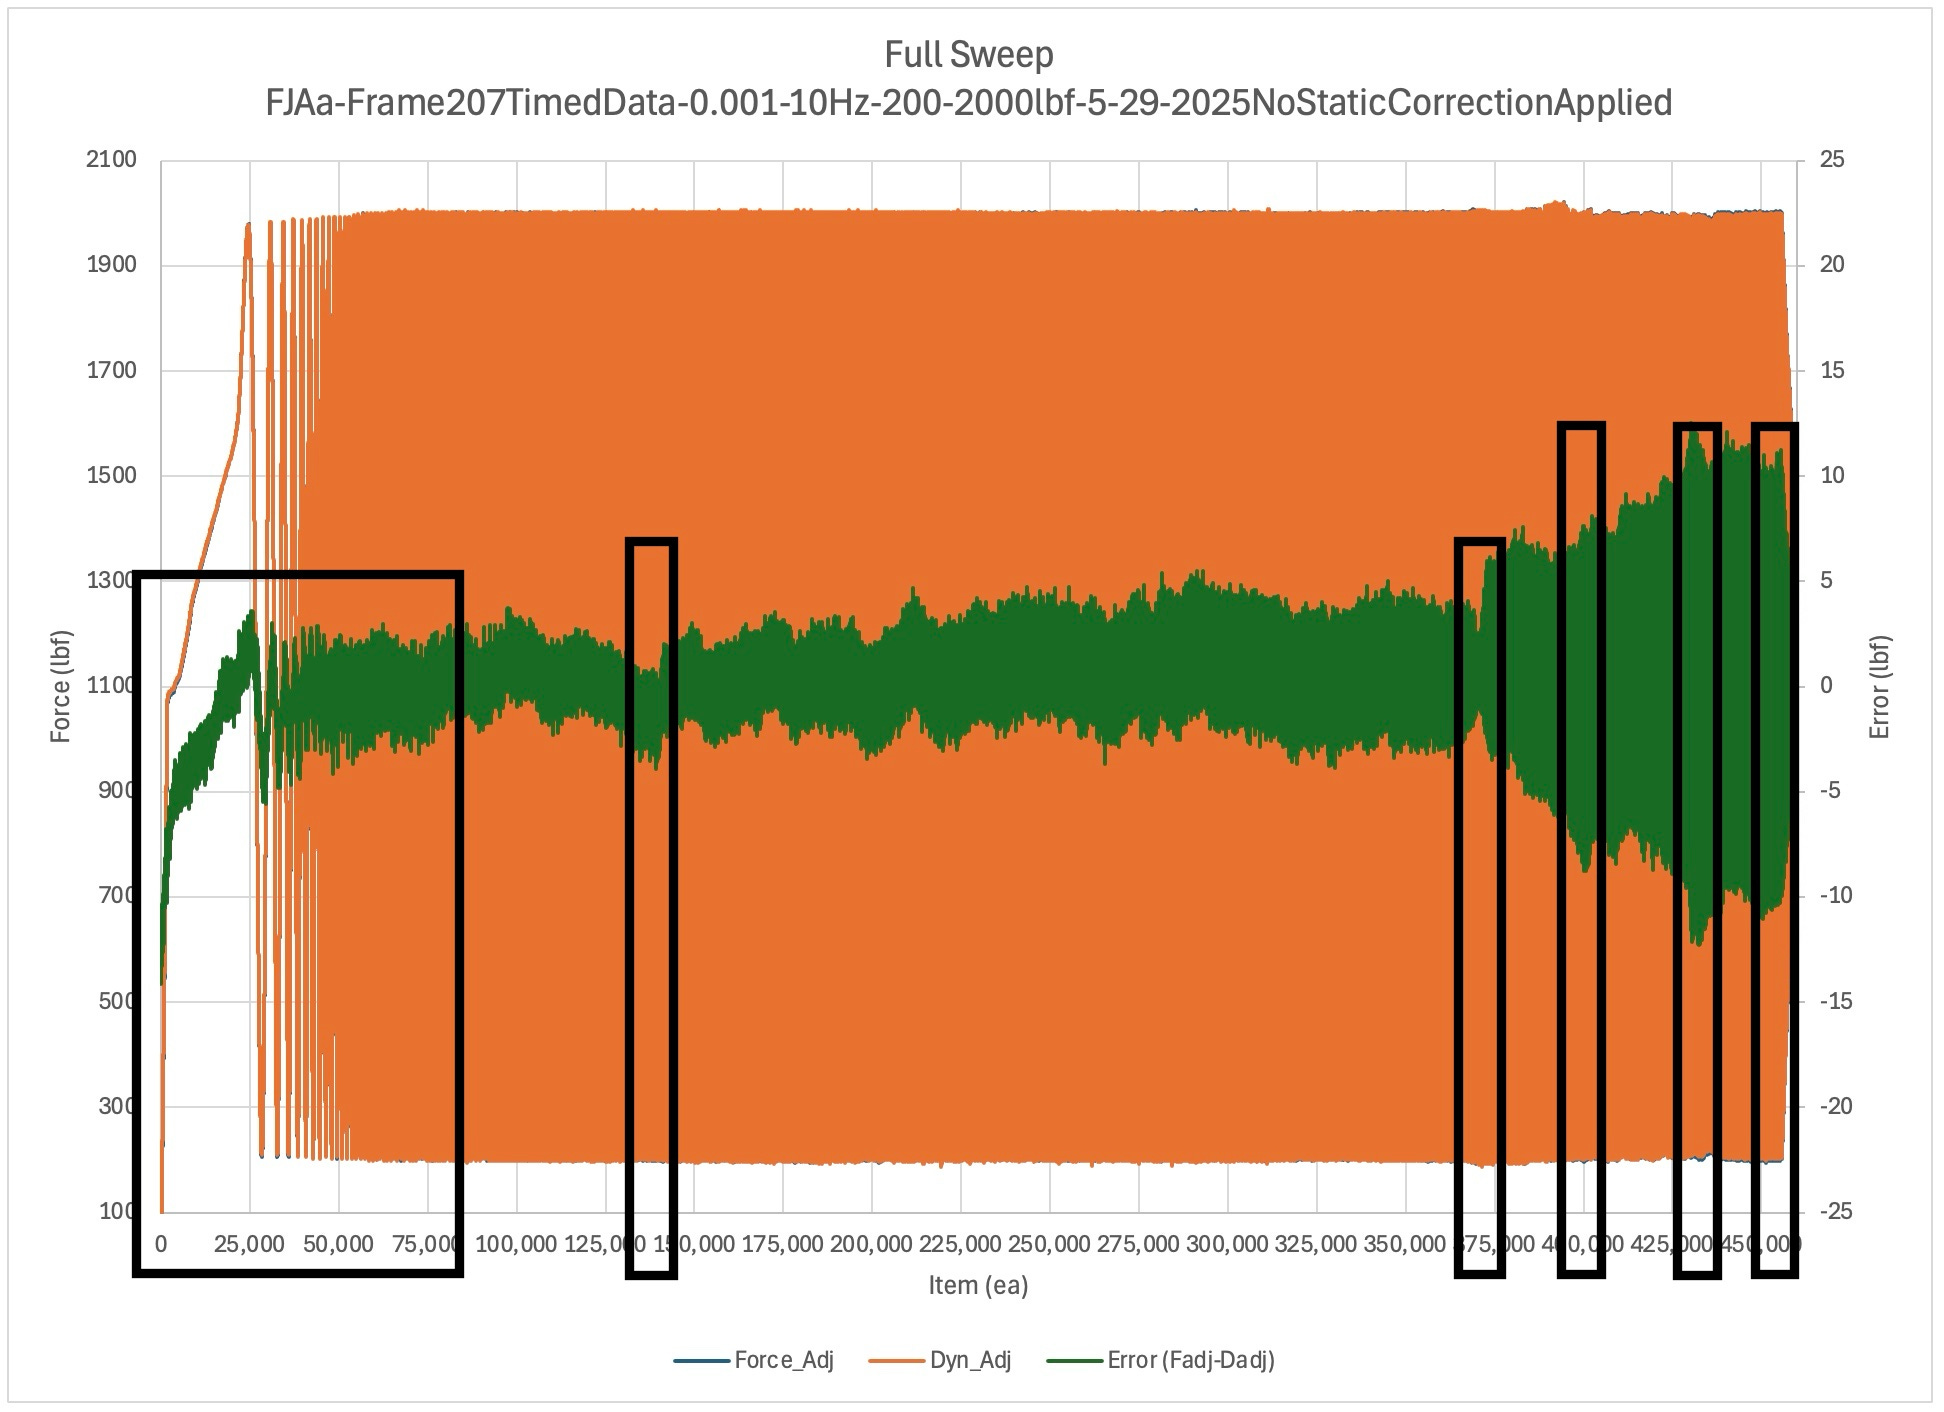
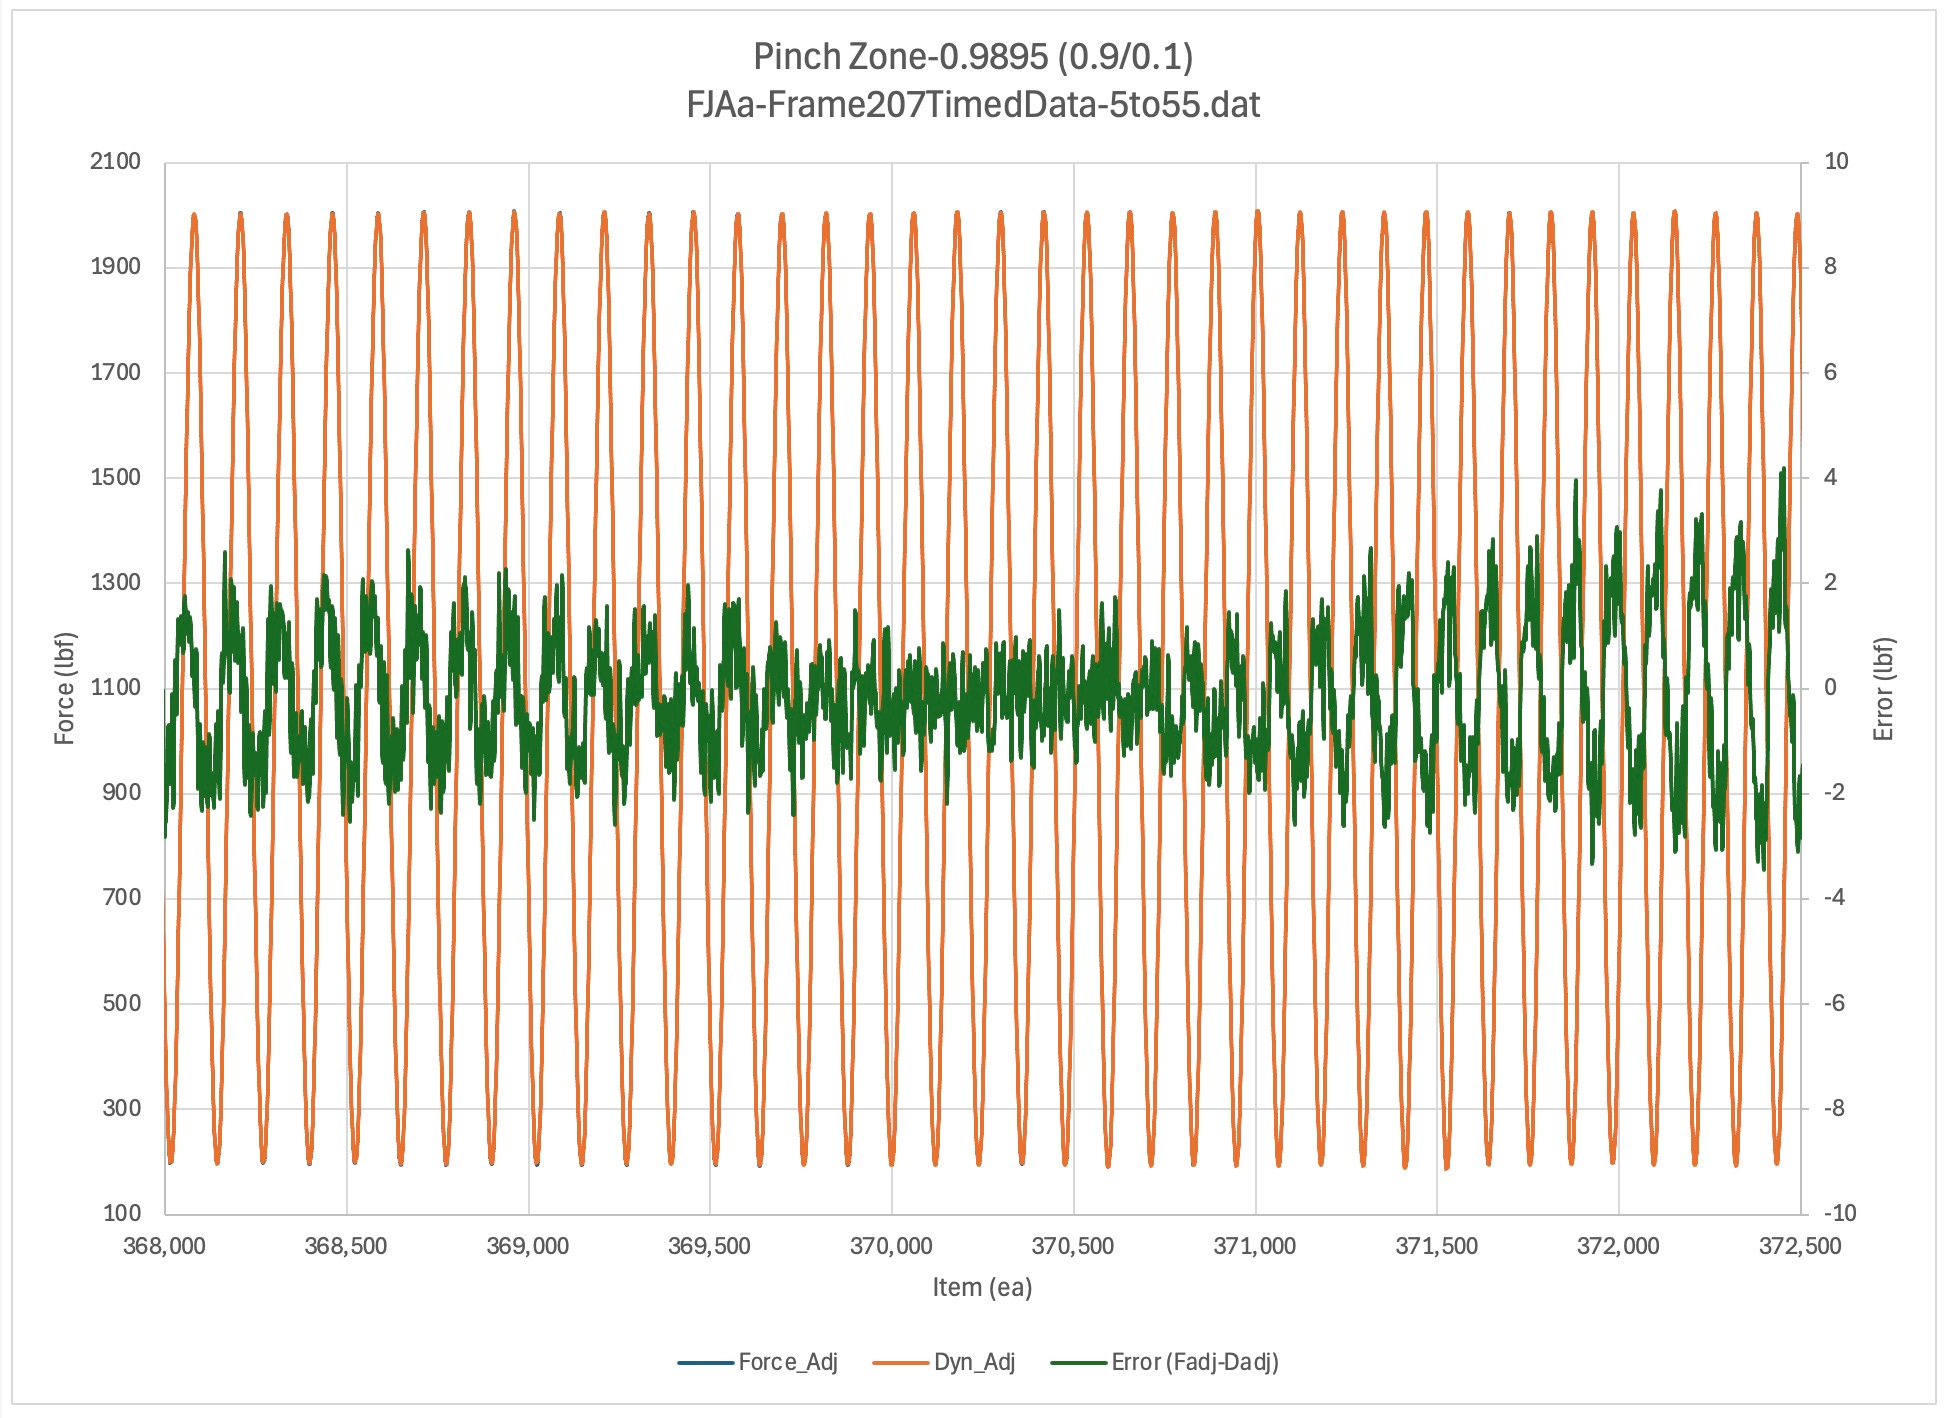
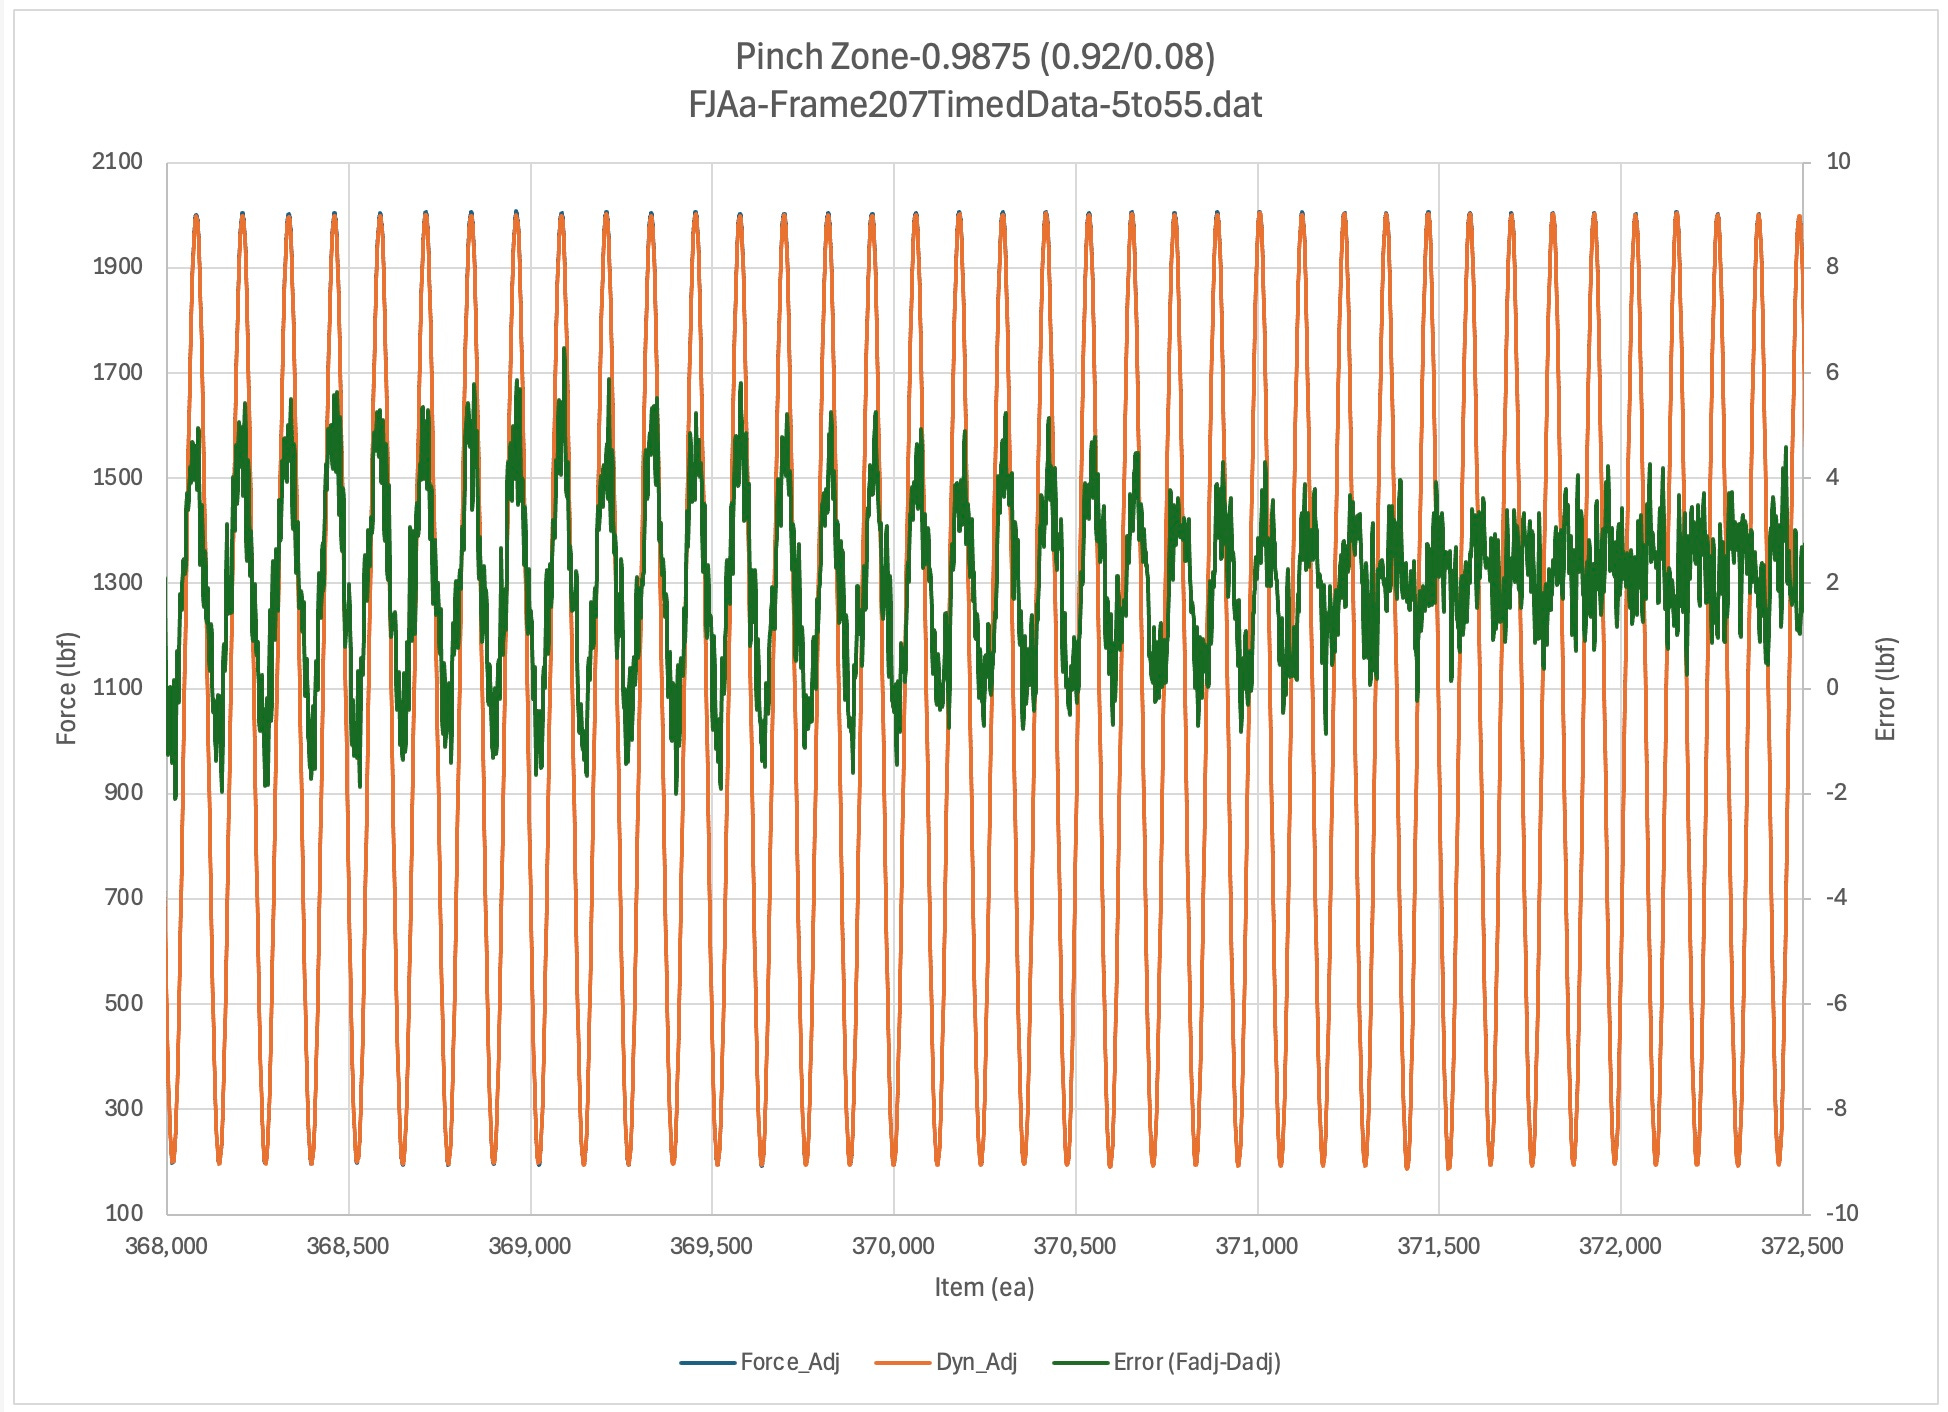
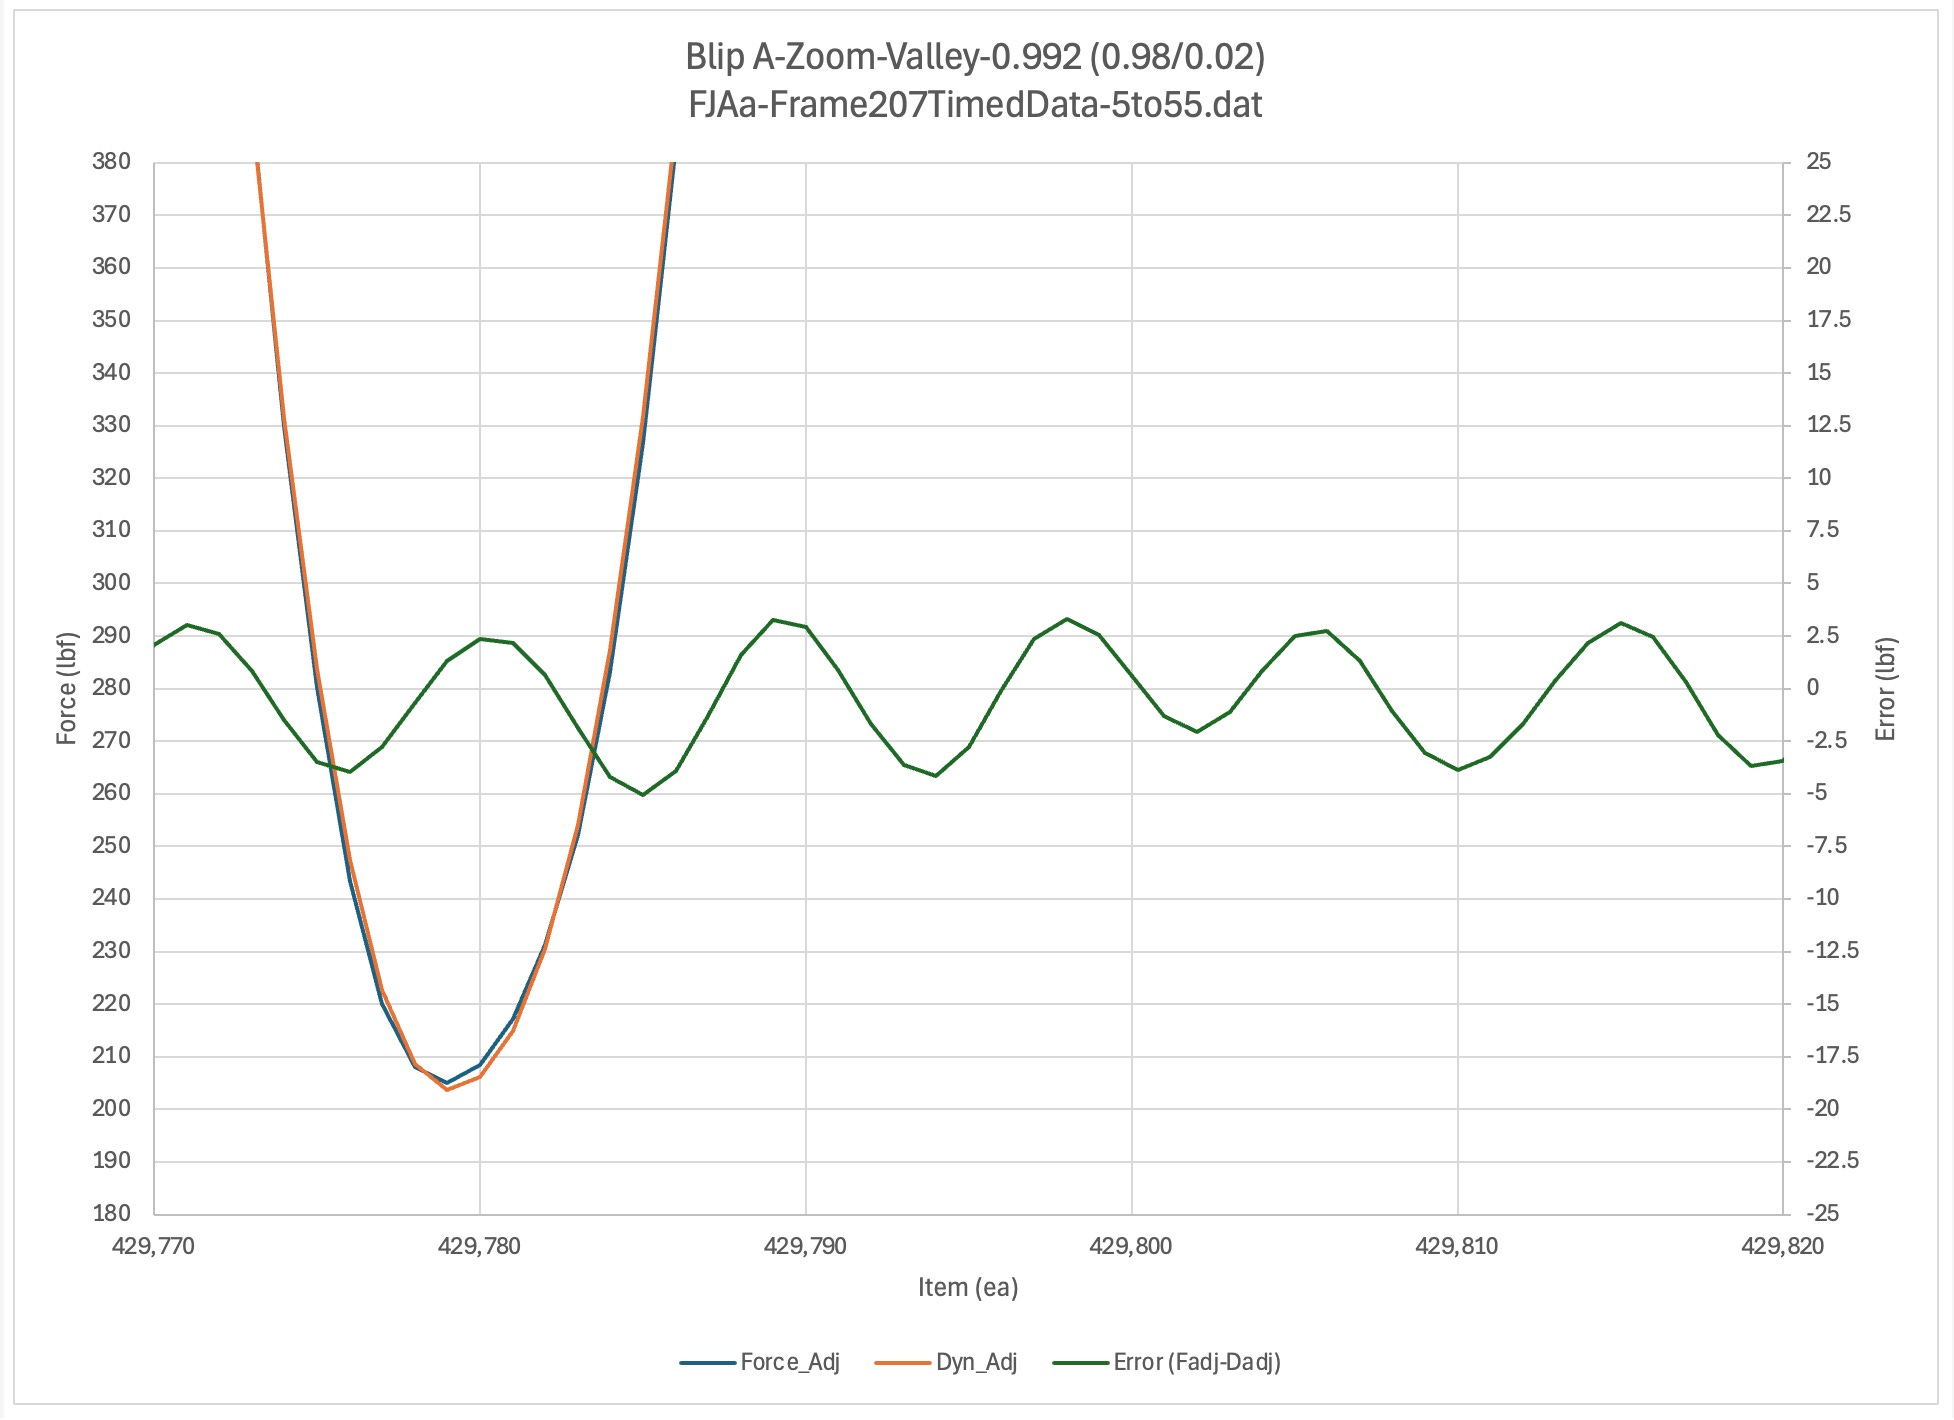
This section shows the errors for small numbers of continuous cycles in each of the major sweep regions (more).
For each plot, a different phase shift, scale, and offset was applied. The methods use will be described in the Methods Summaries section in the future. Refer to Region D of the Sine Sweep Trainer for a reference table of good values for each test region. (fjaa120021b)
The regions of interest are:
Full Sweep
Up / Comments / Launch Peaks
Discussion TBD
Launch Peaks
Up / Comments / NextTBD
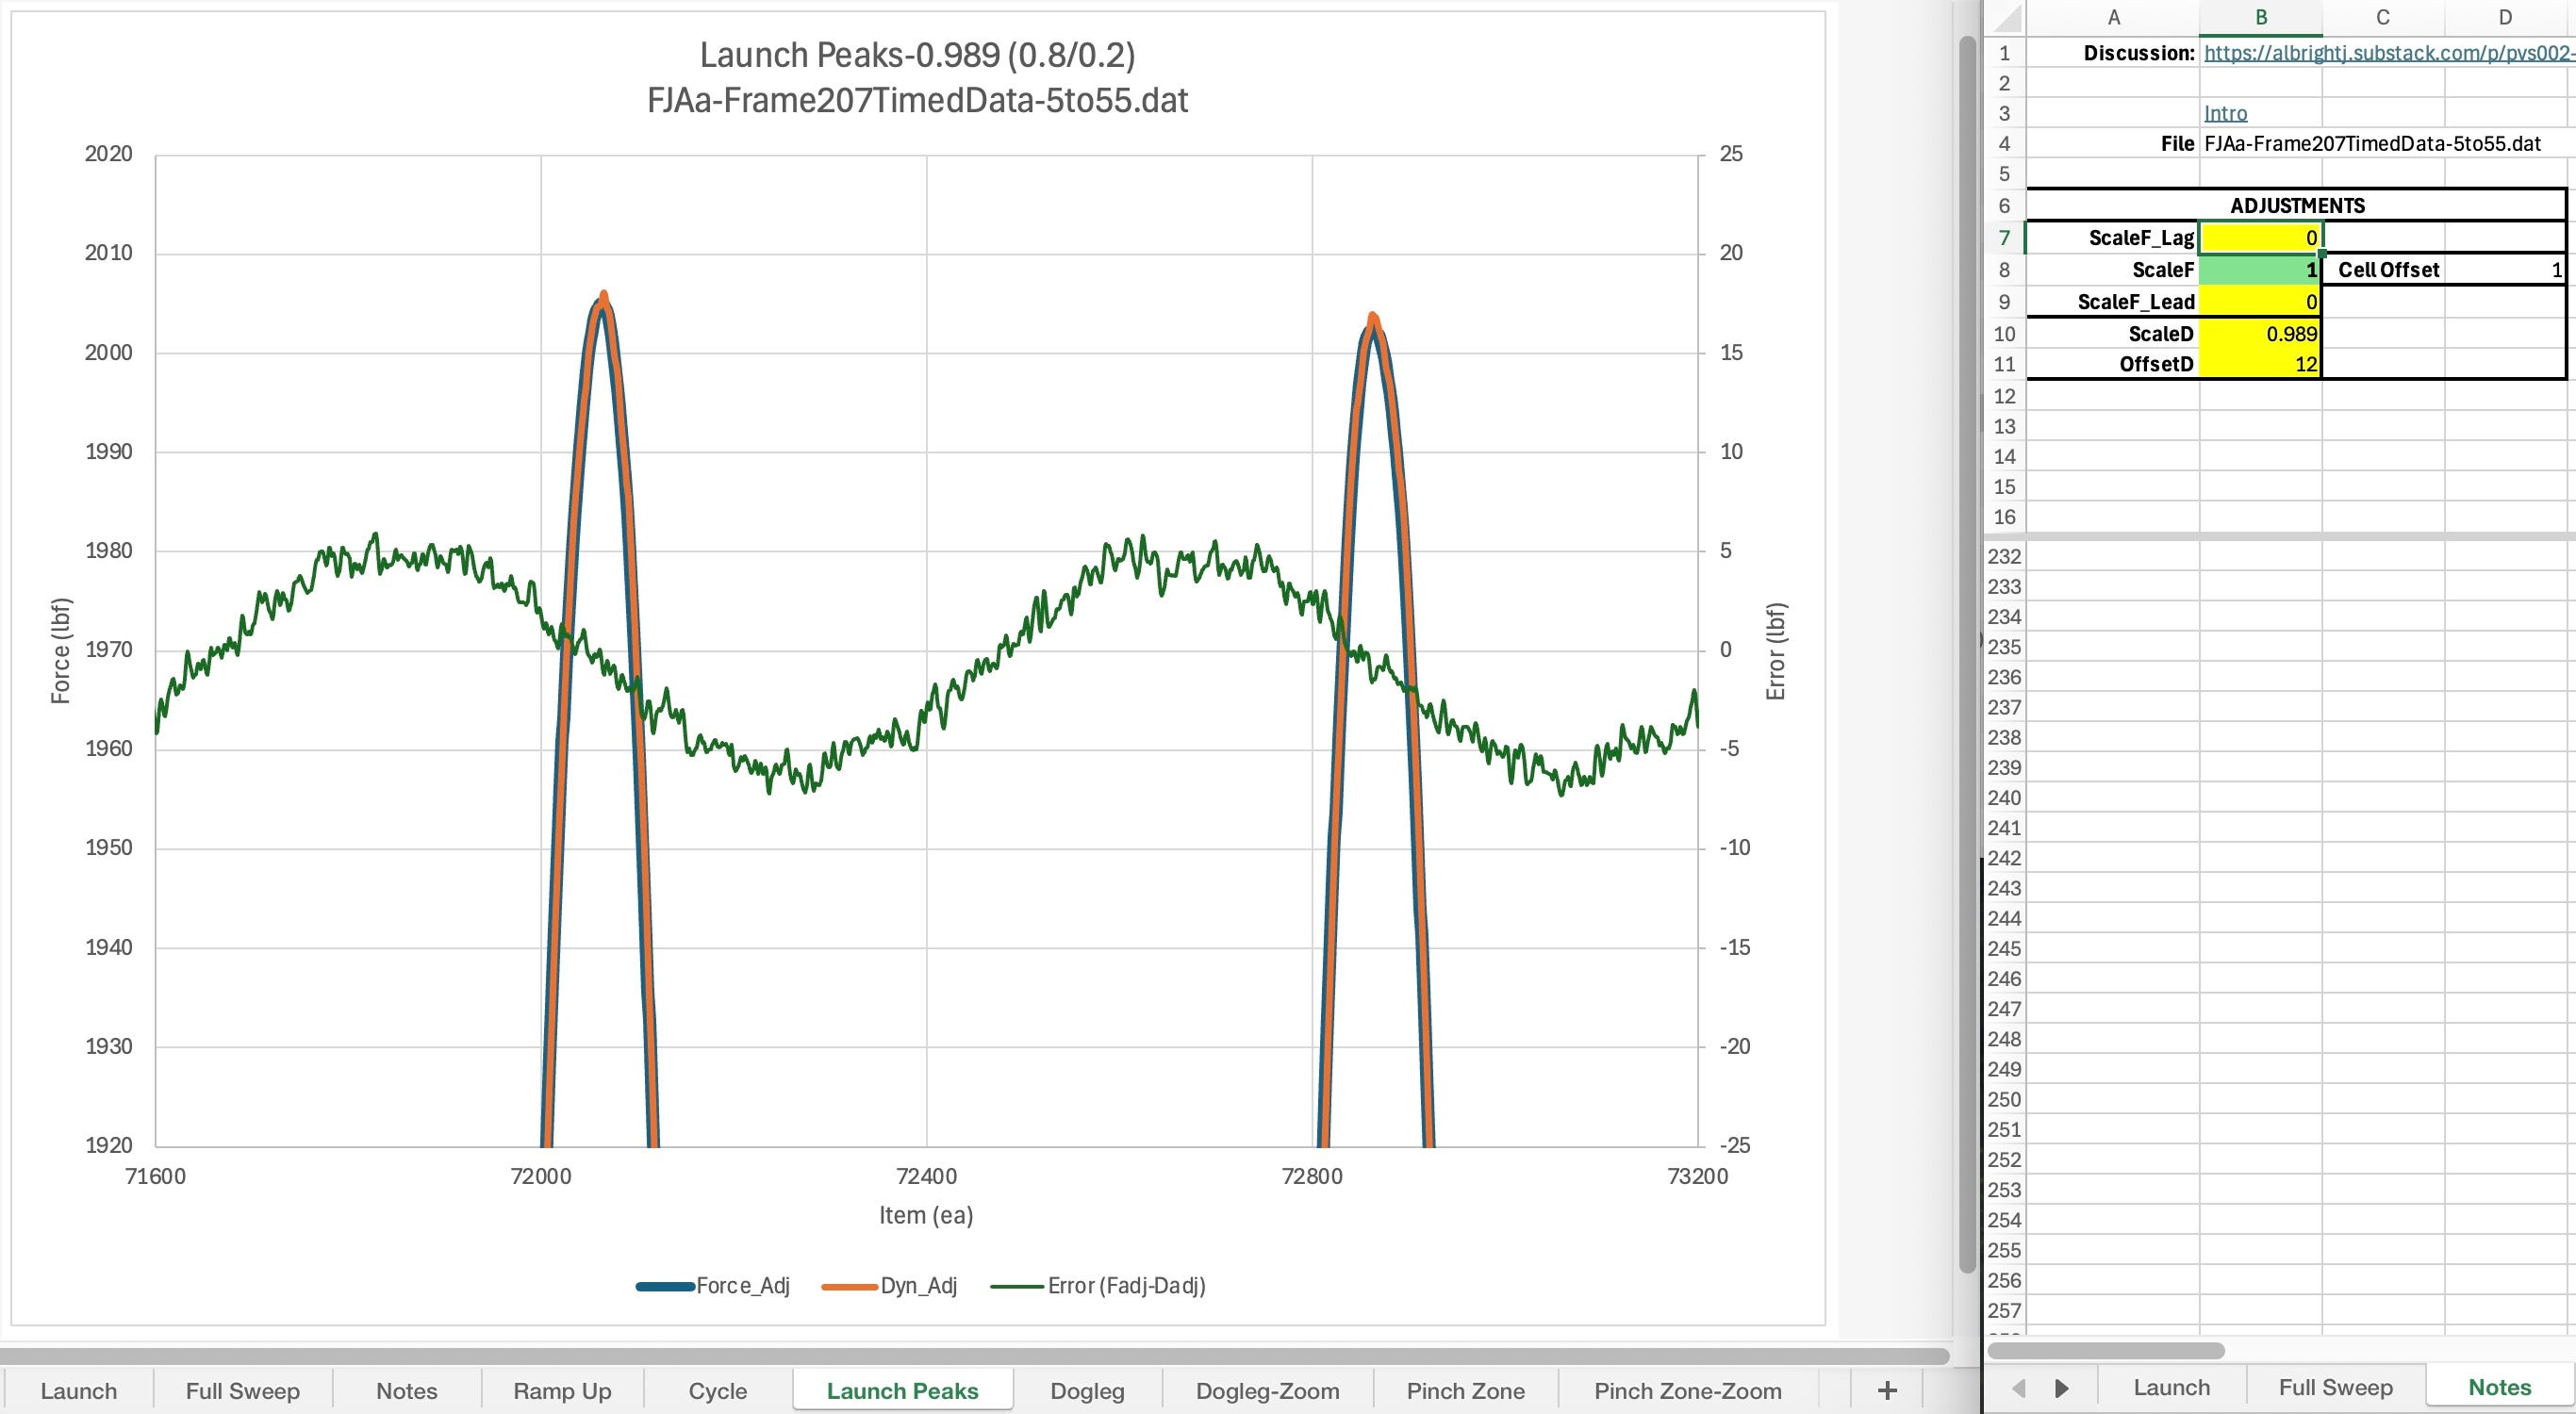
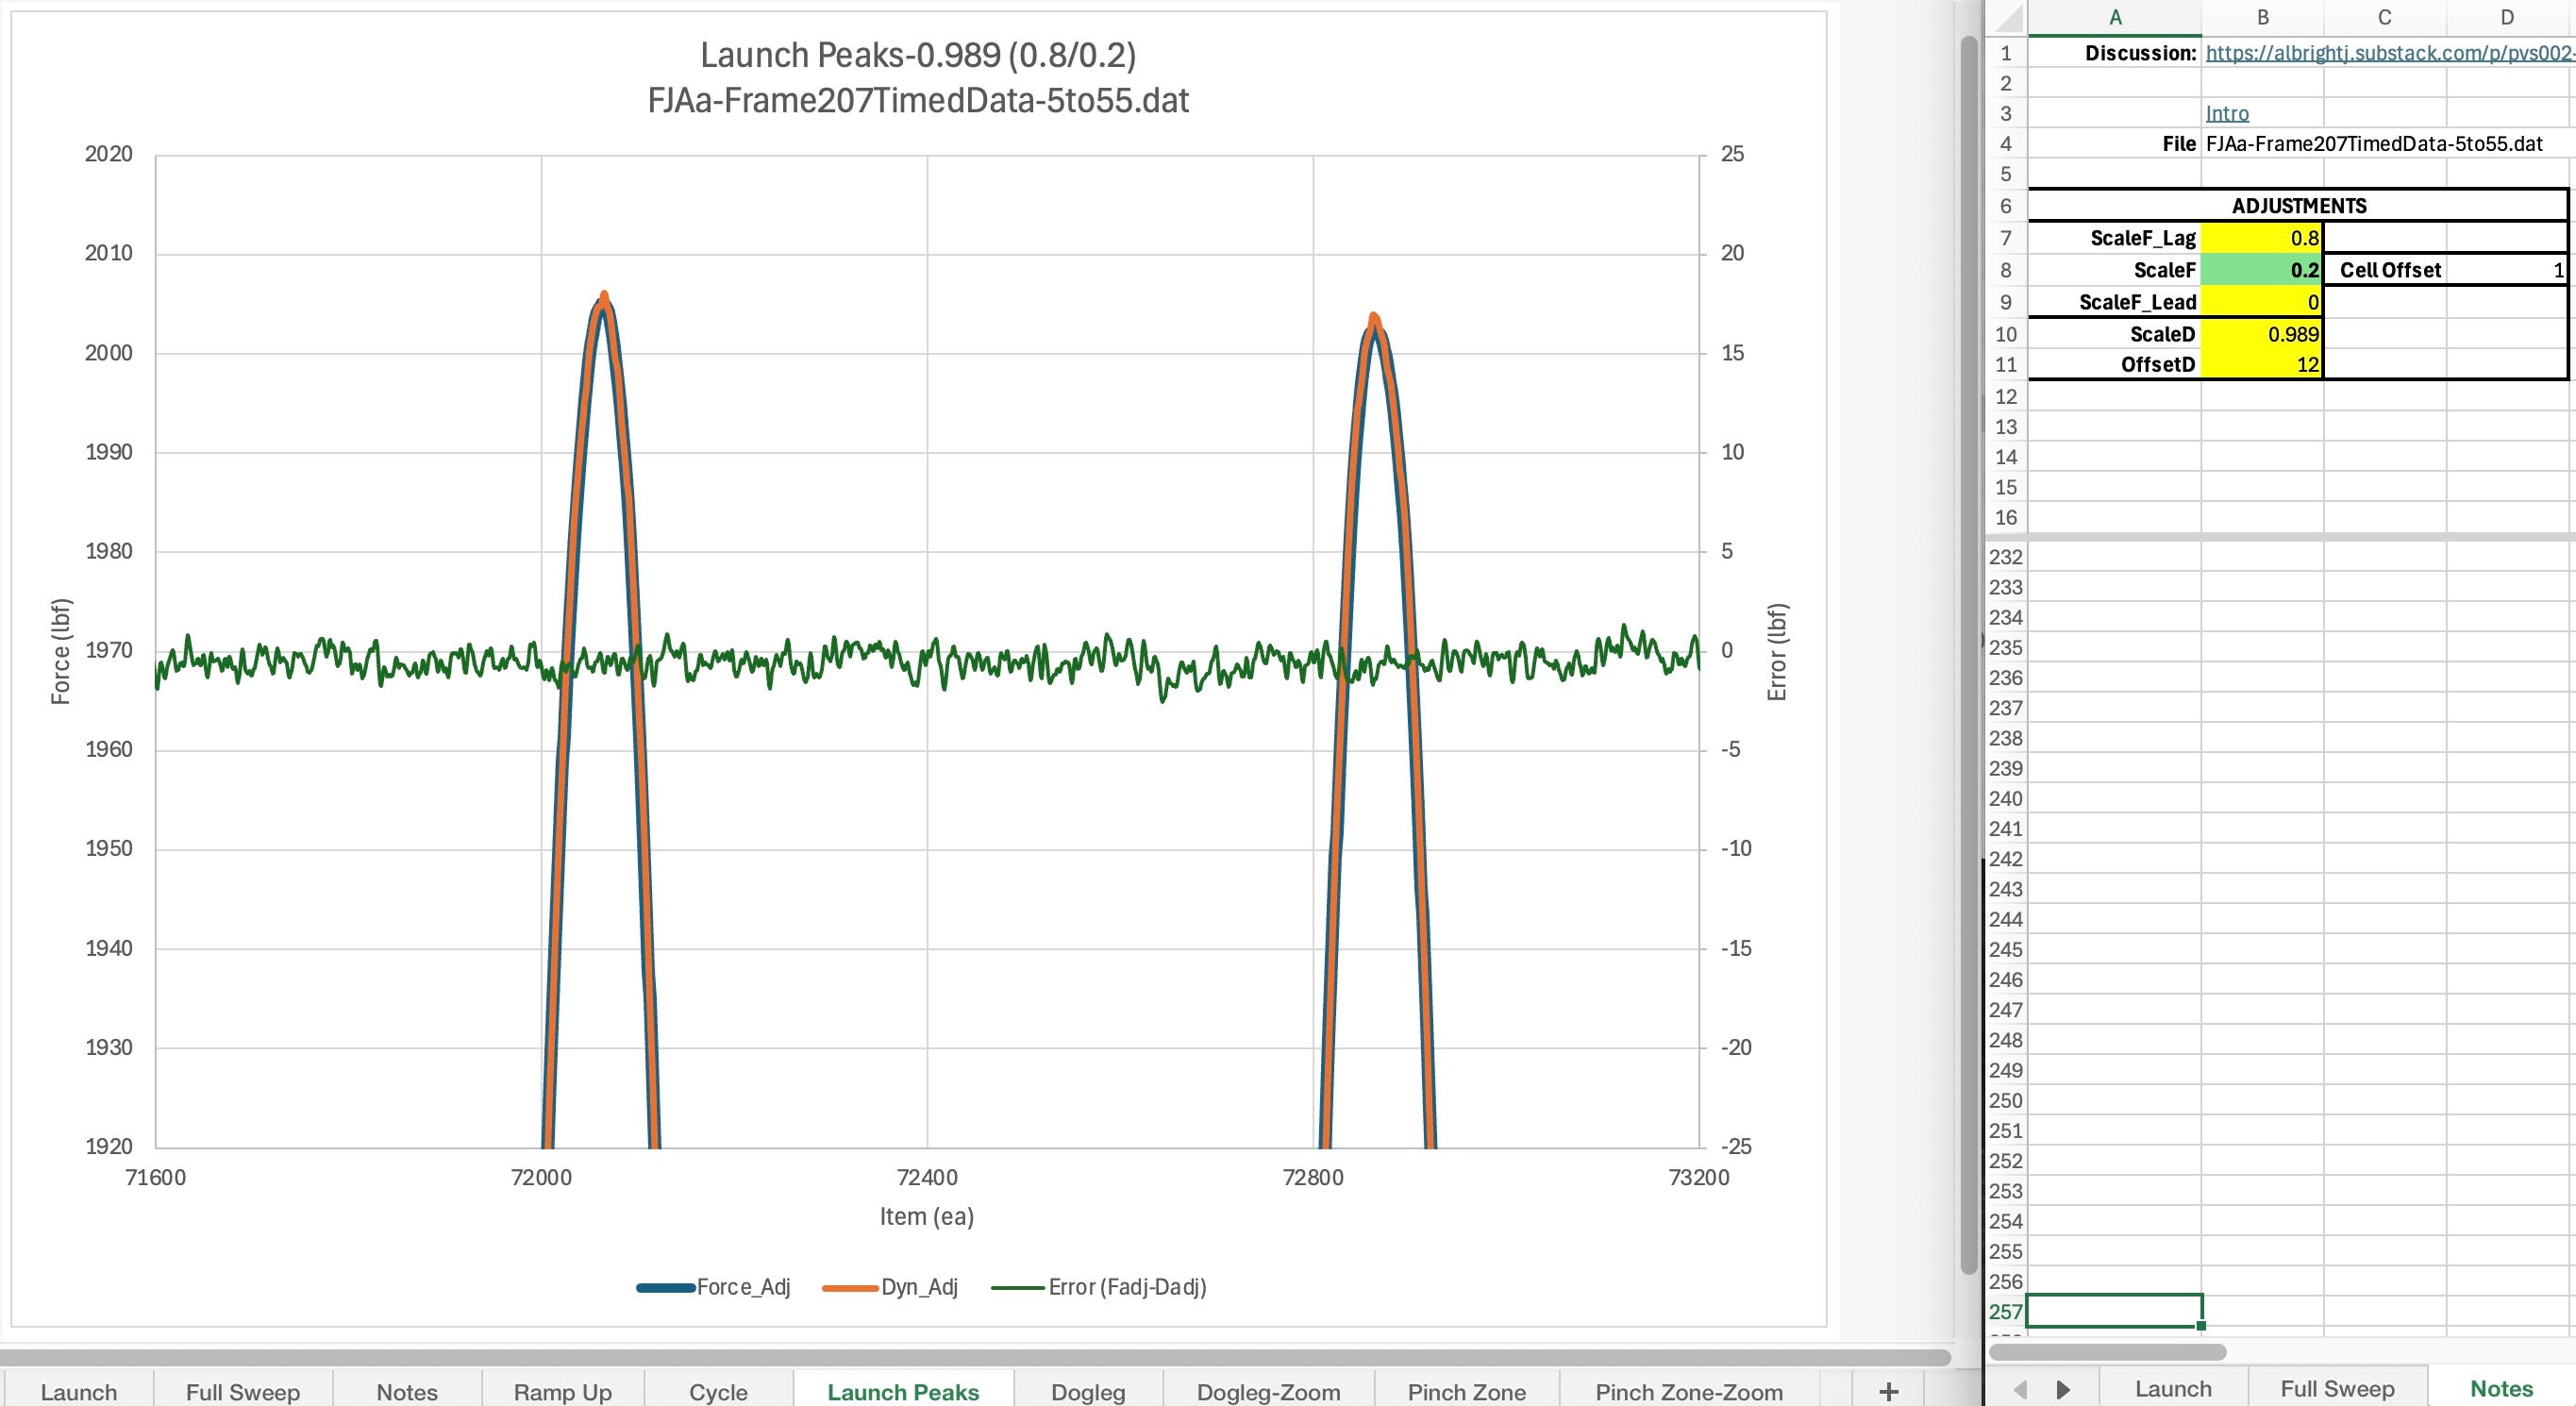
An illustration of how peak errors can be monitored in a plot. The significance of the flat error line in this plot is that the errors are nominally the same regardless of the point in the waveform. While not essential for the heart of E467 it gives quick and good assurance that the dynamometer and the test system load cell for this operating point are indeed reporting the same load. When the error plot is not flat that shows the two transducers are reporting different loads. While the standard is only interested in deviations at the peak and valley, the likelihood that the peak and valley numbers are correct is contingent on the system behaving as our theory predicts. When there are errors, as long as we can explain them theoretically we are on good ground. If we can’t then that seems to raise doubts that the values obtained for the peaks and valleys are believable as well. (fjaa120021a).
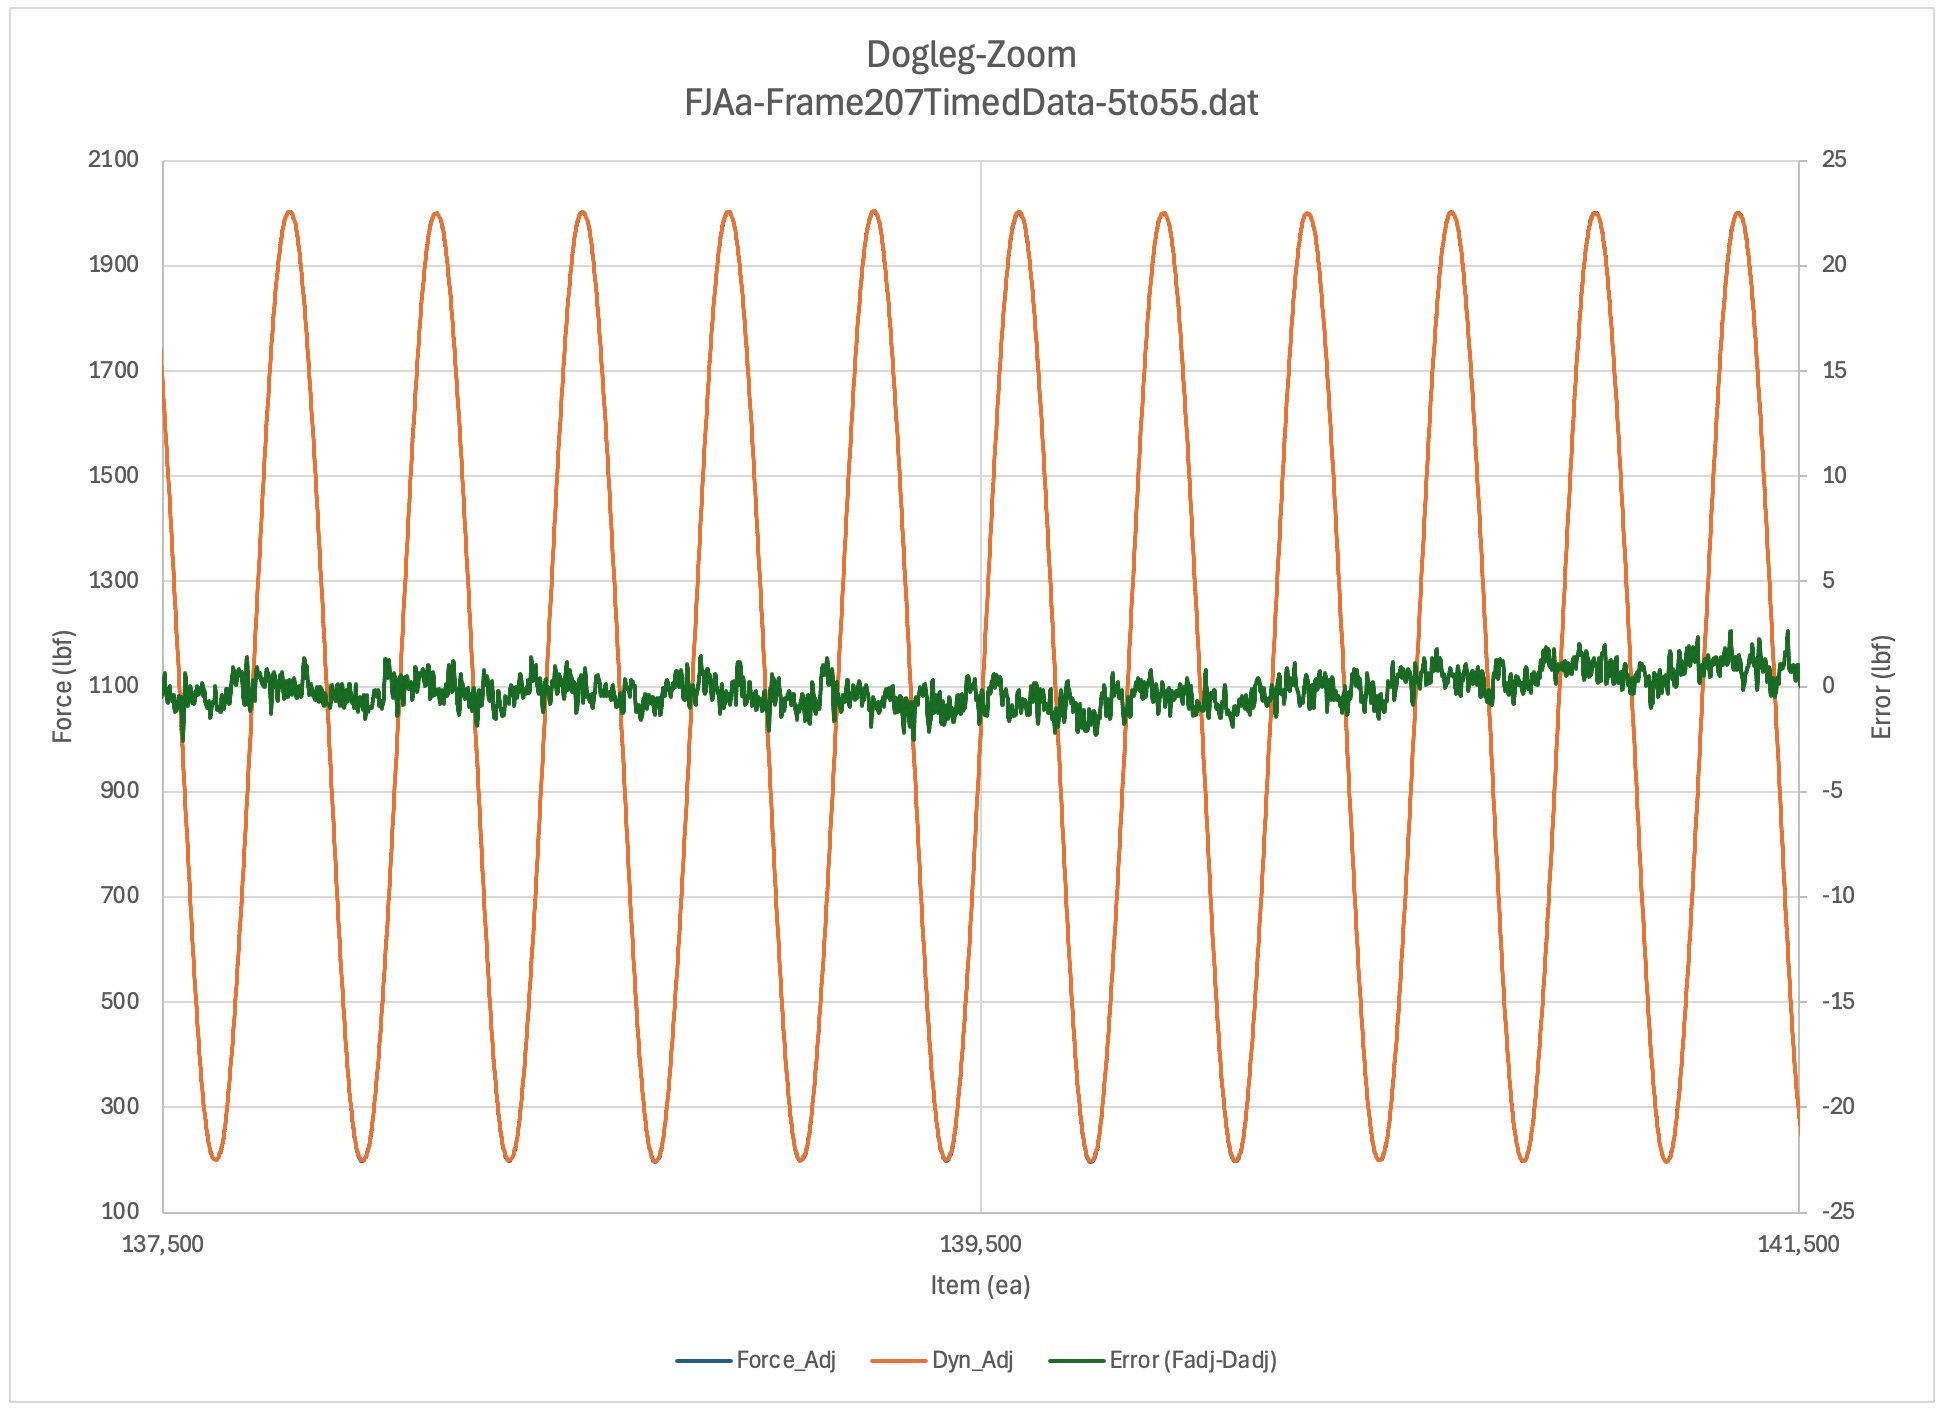
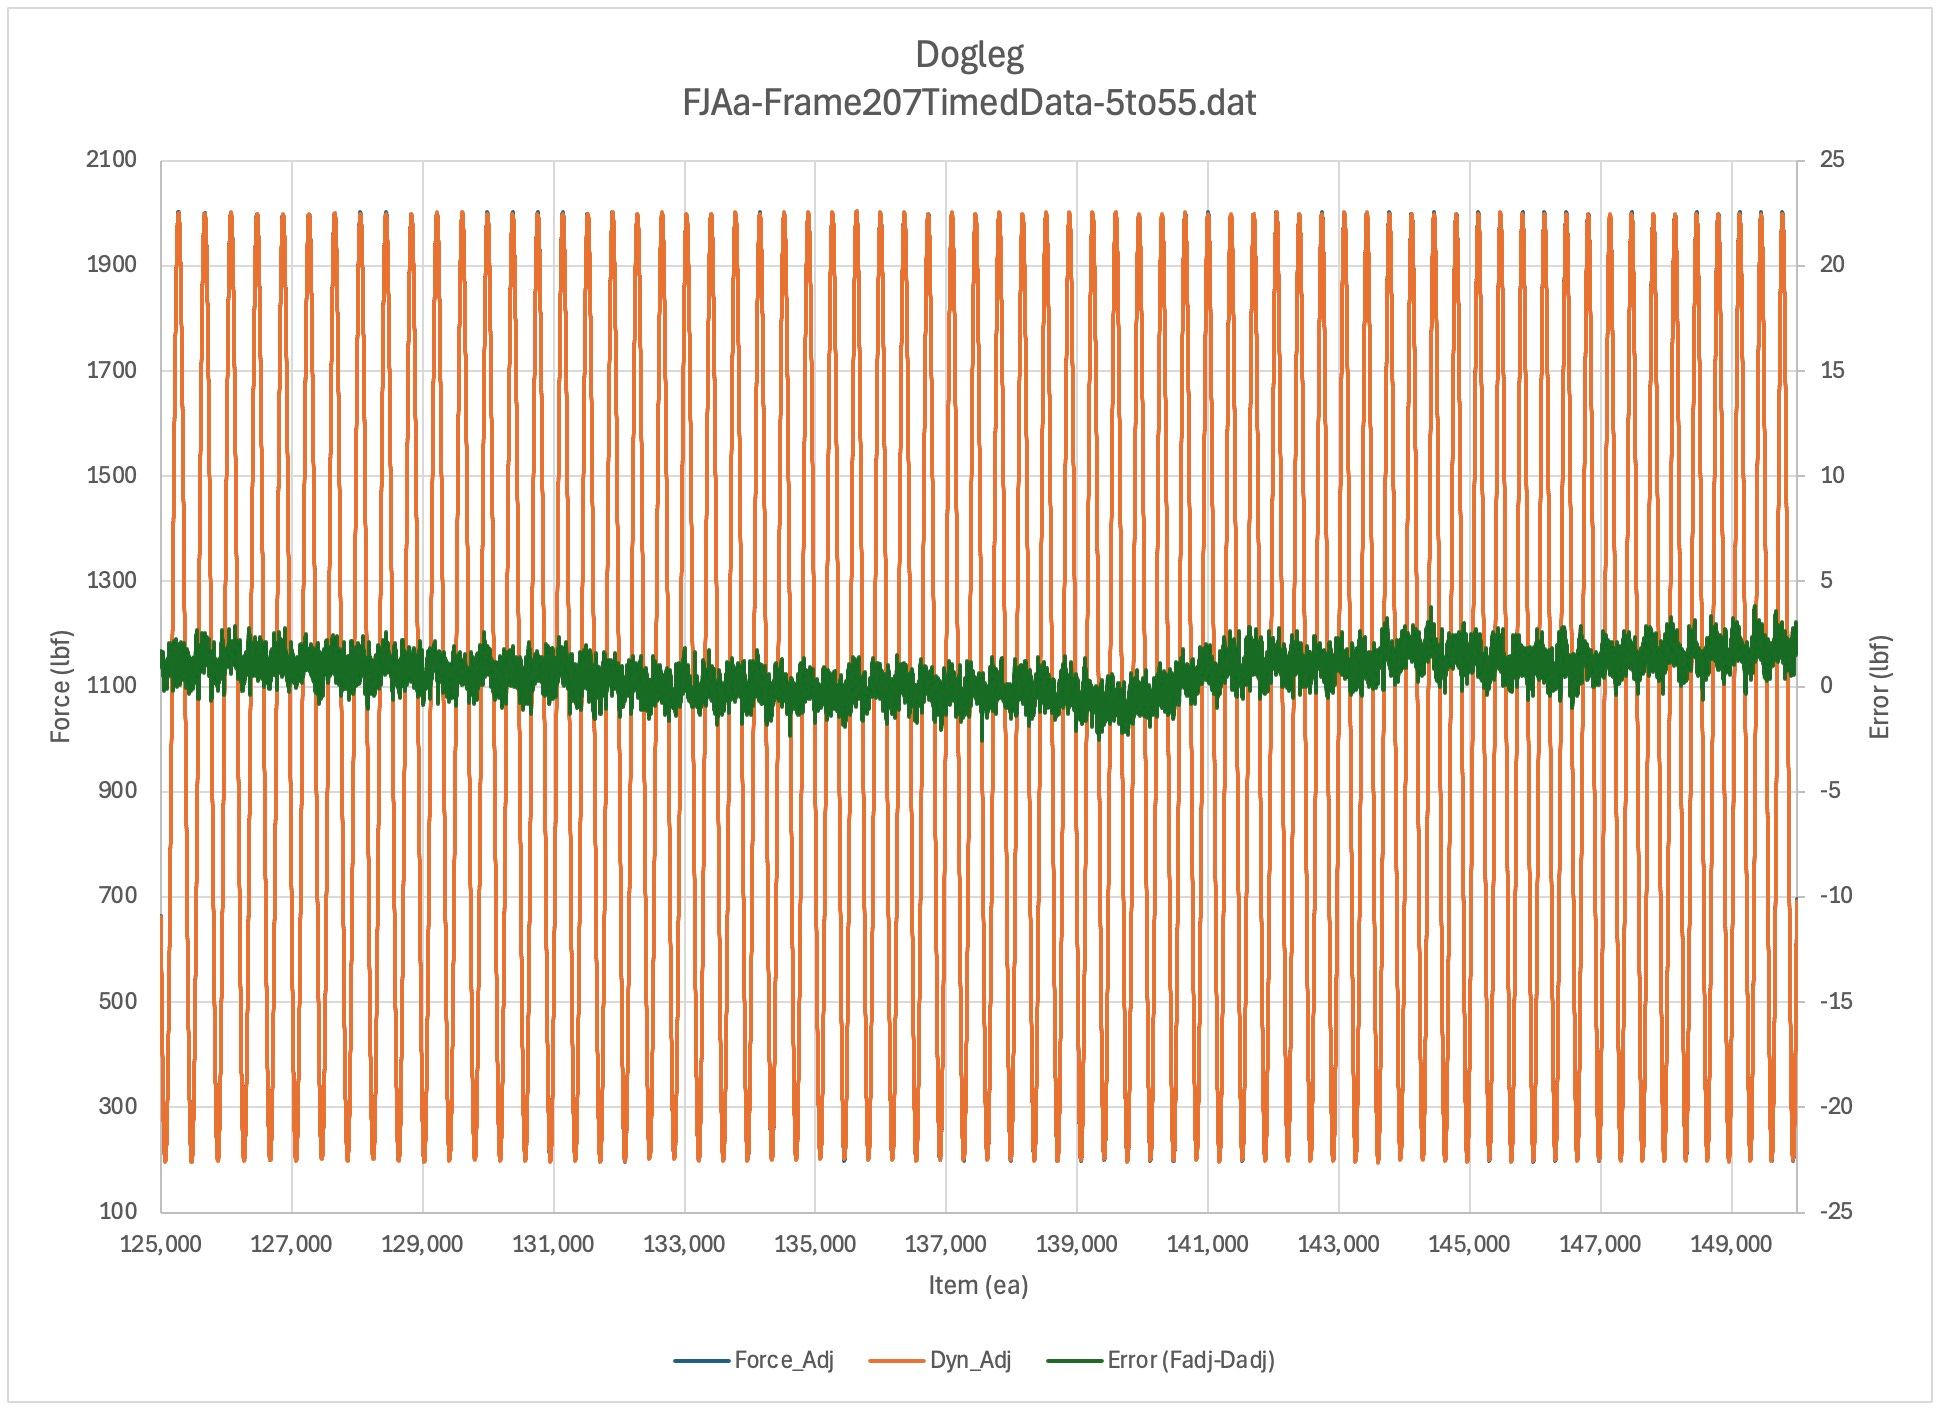
Dogleg
Up / Comments / NextTBD
Discussion TBD
Dogleg [139500]: 0.988 (0.9/0.1)
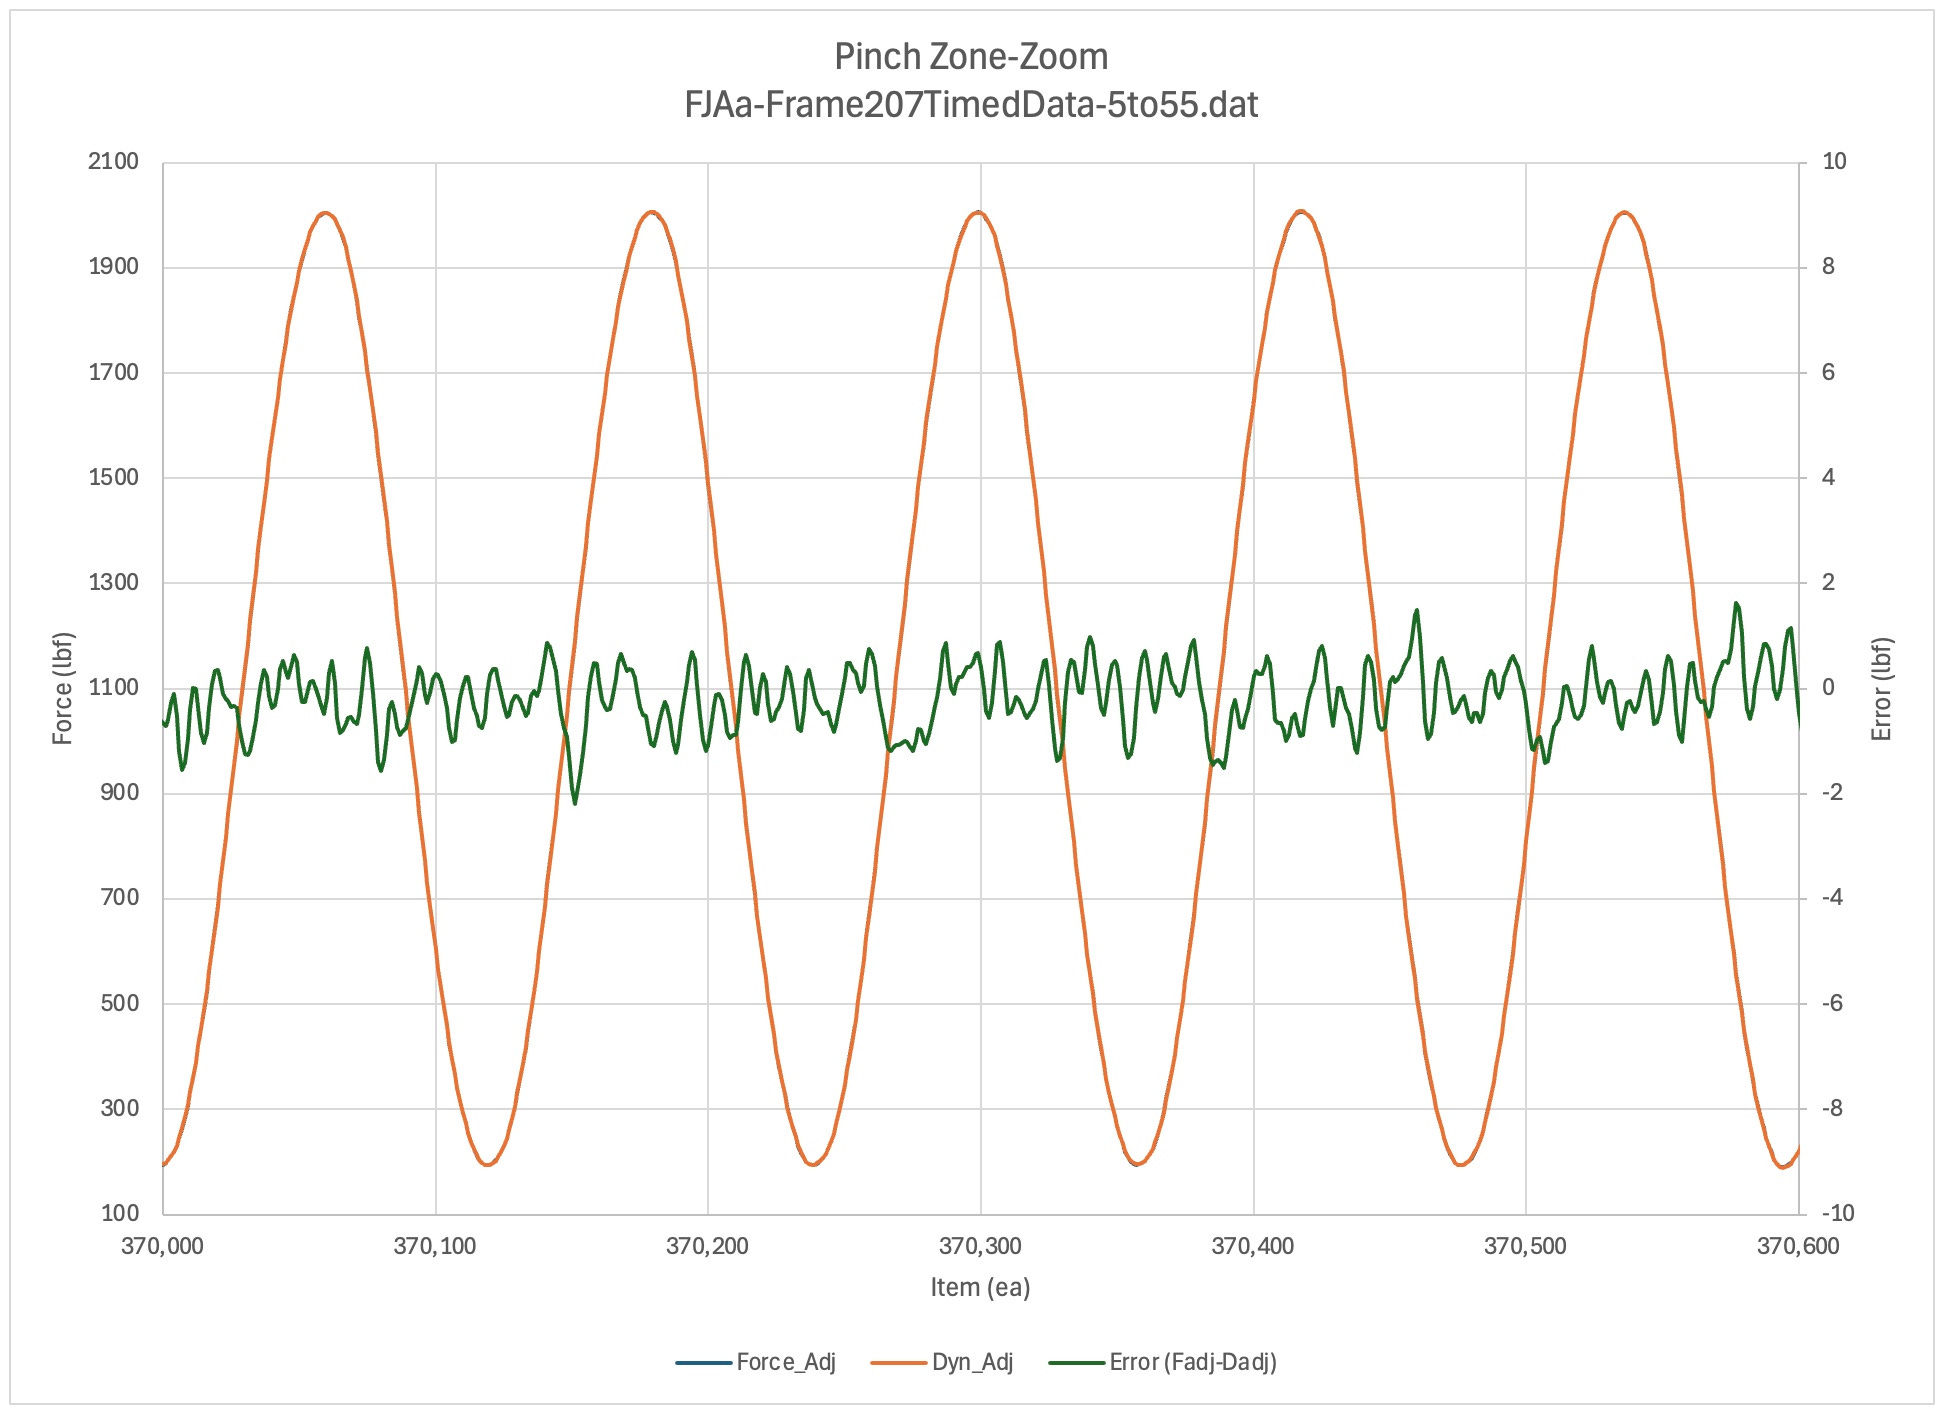
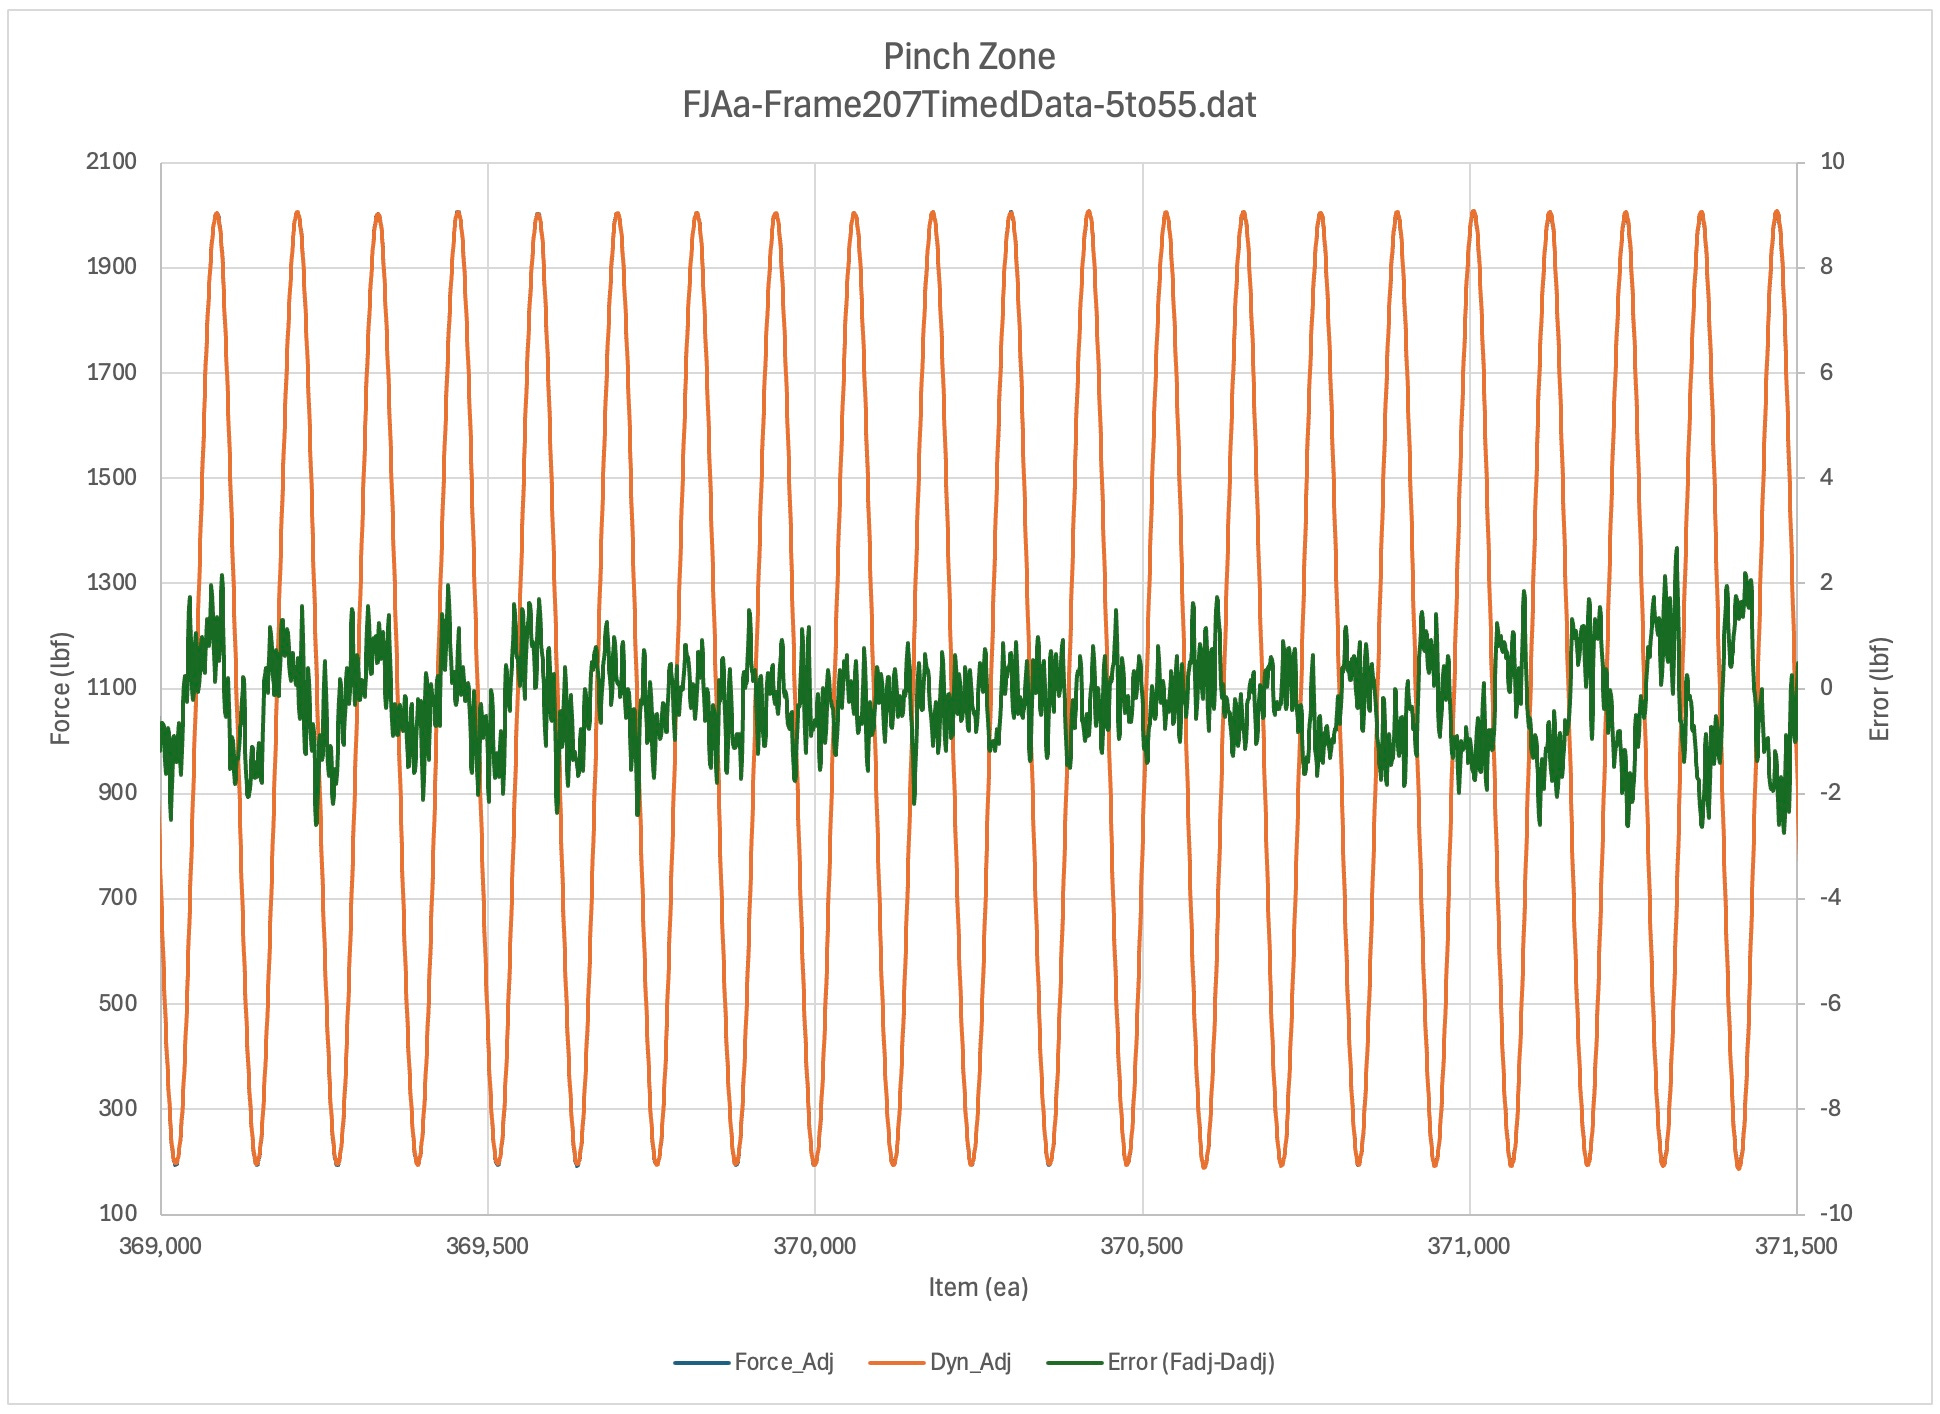
Pinch Zone
Up / Comments / NextTBD
Discussion TBD
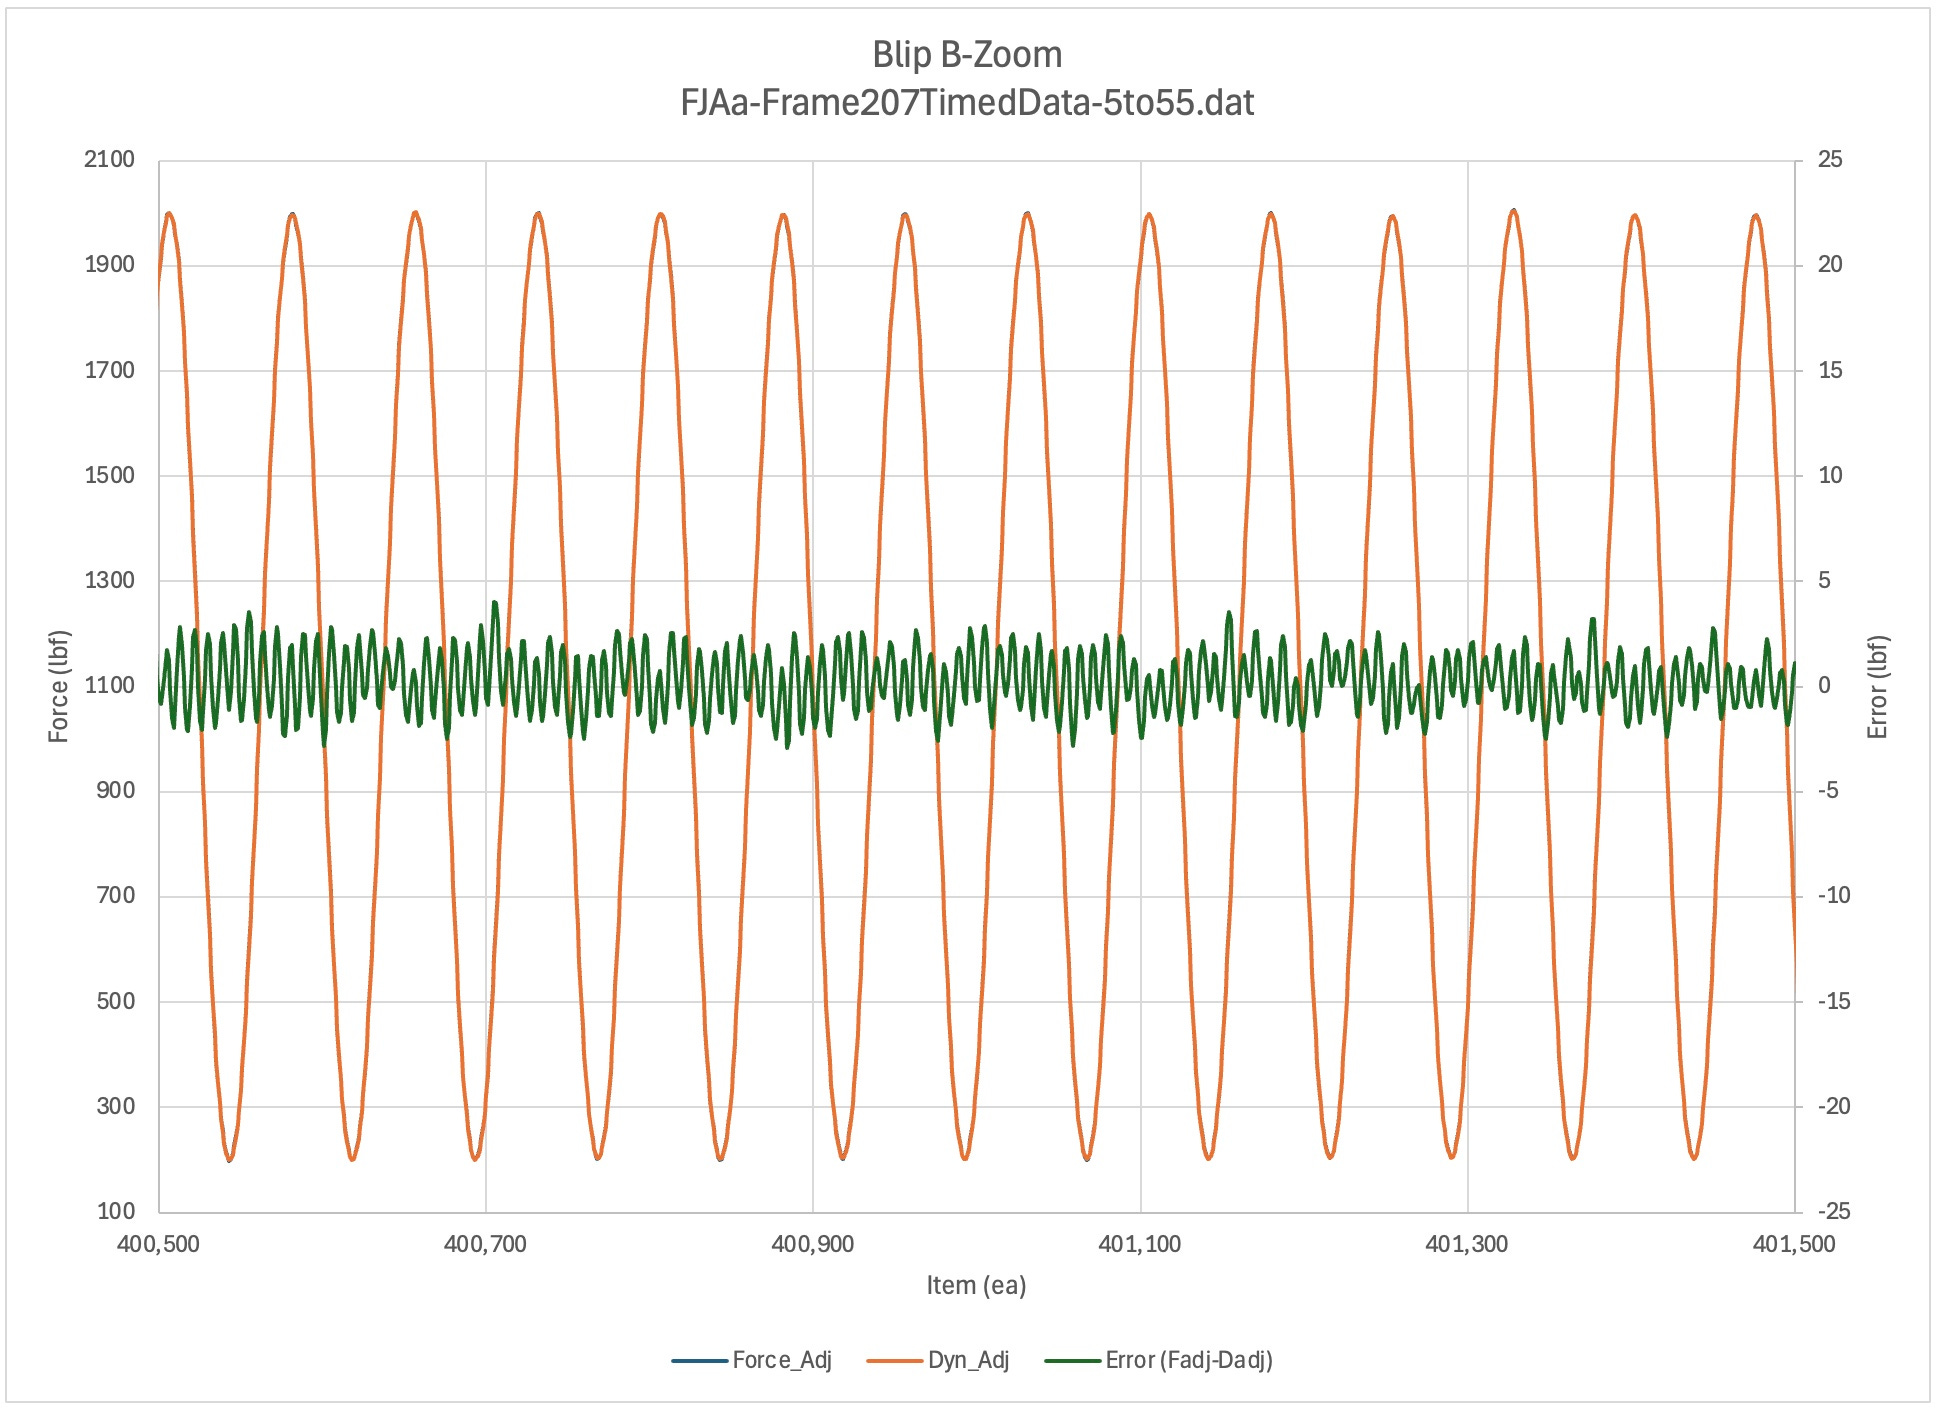
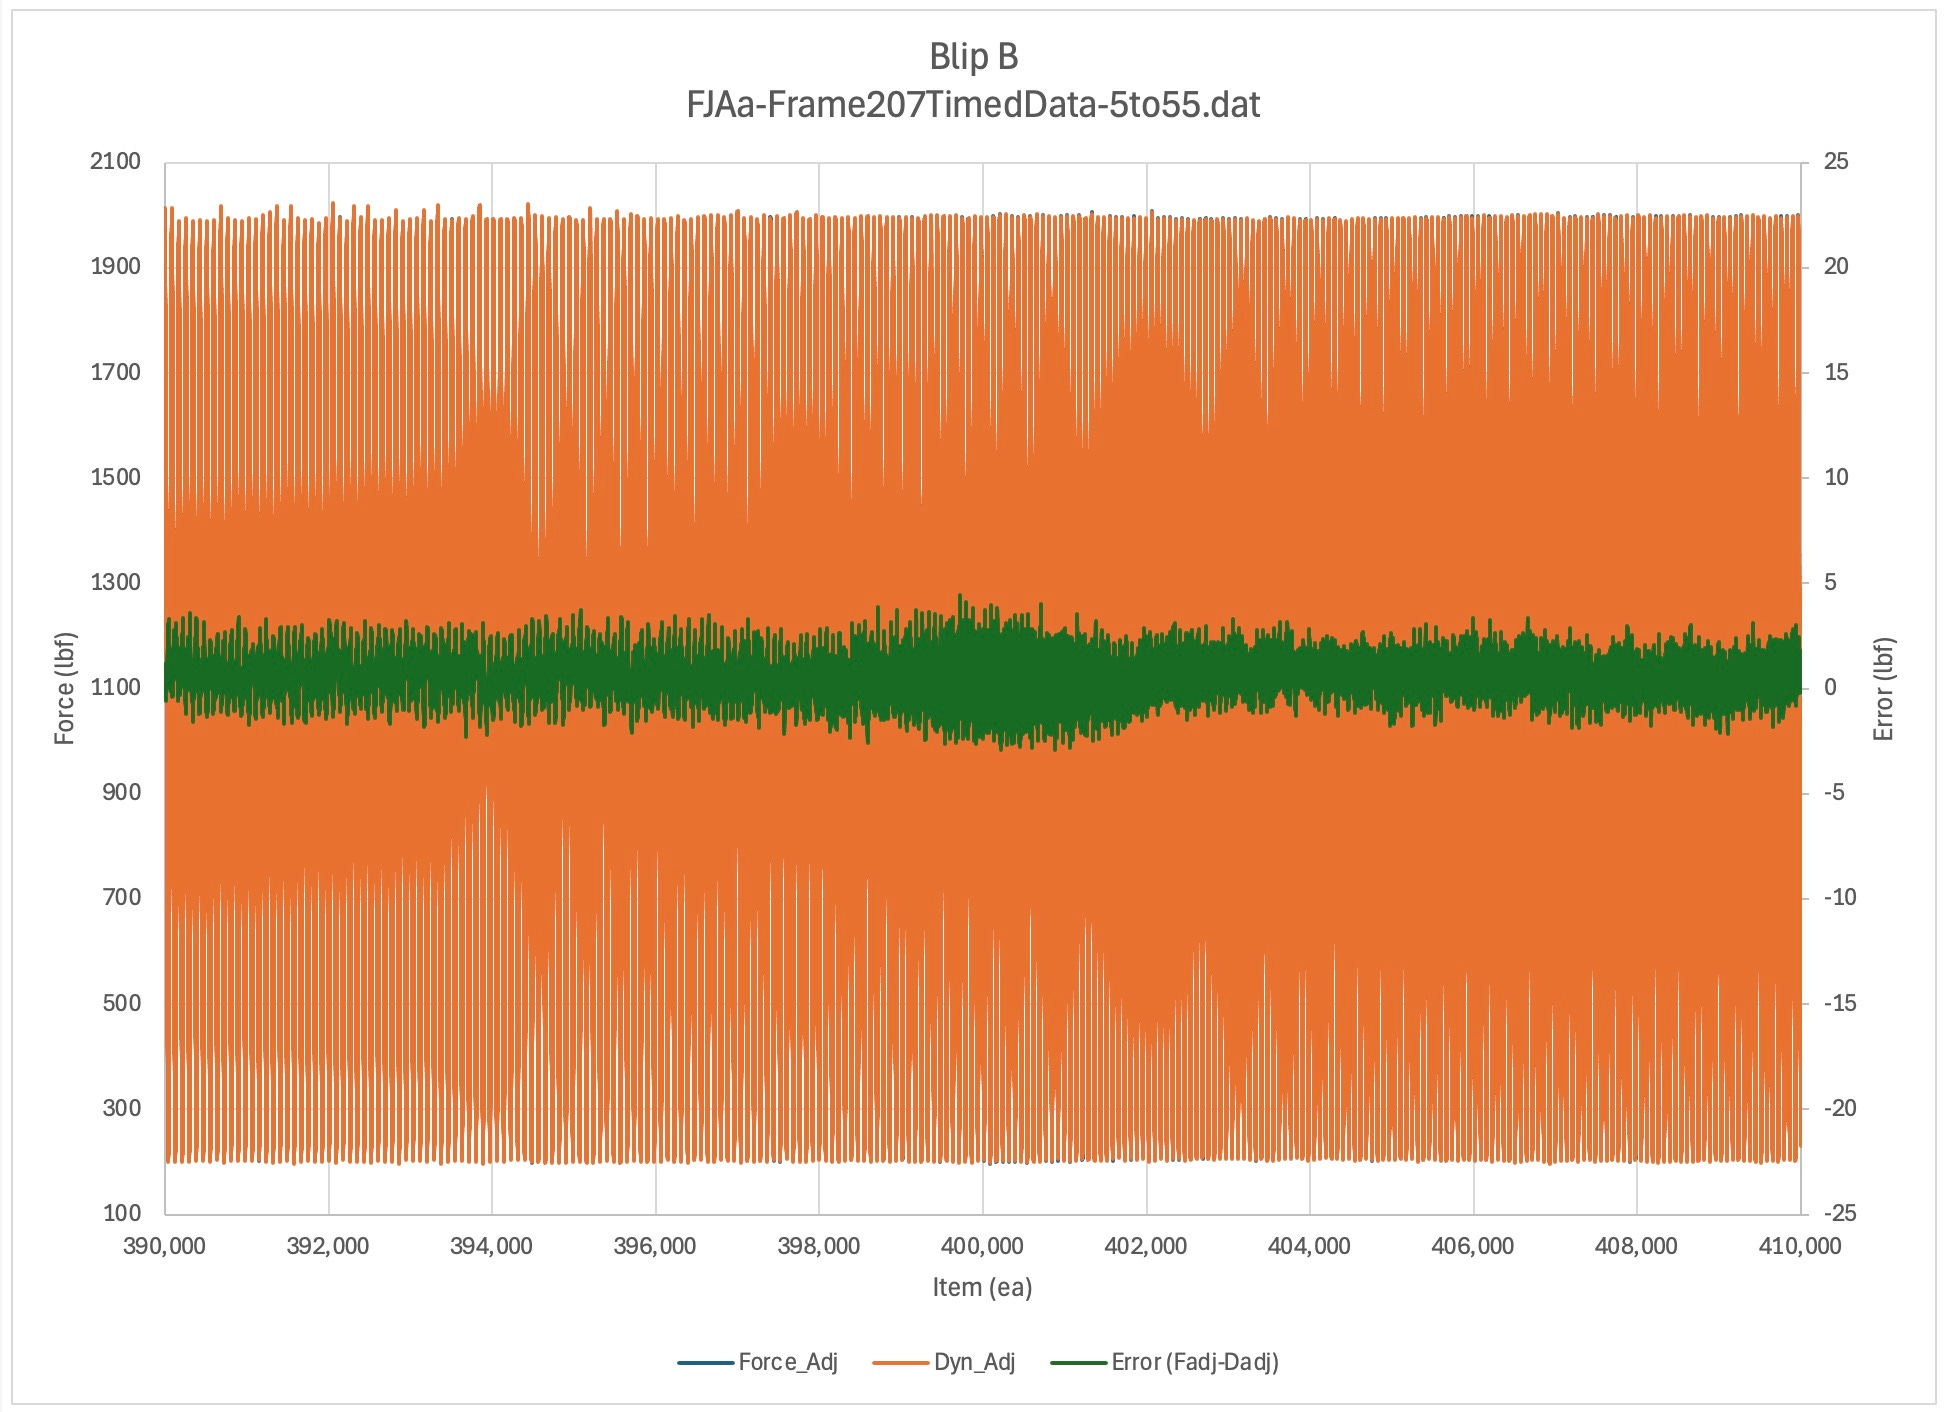
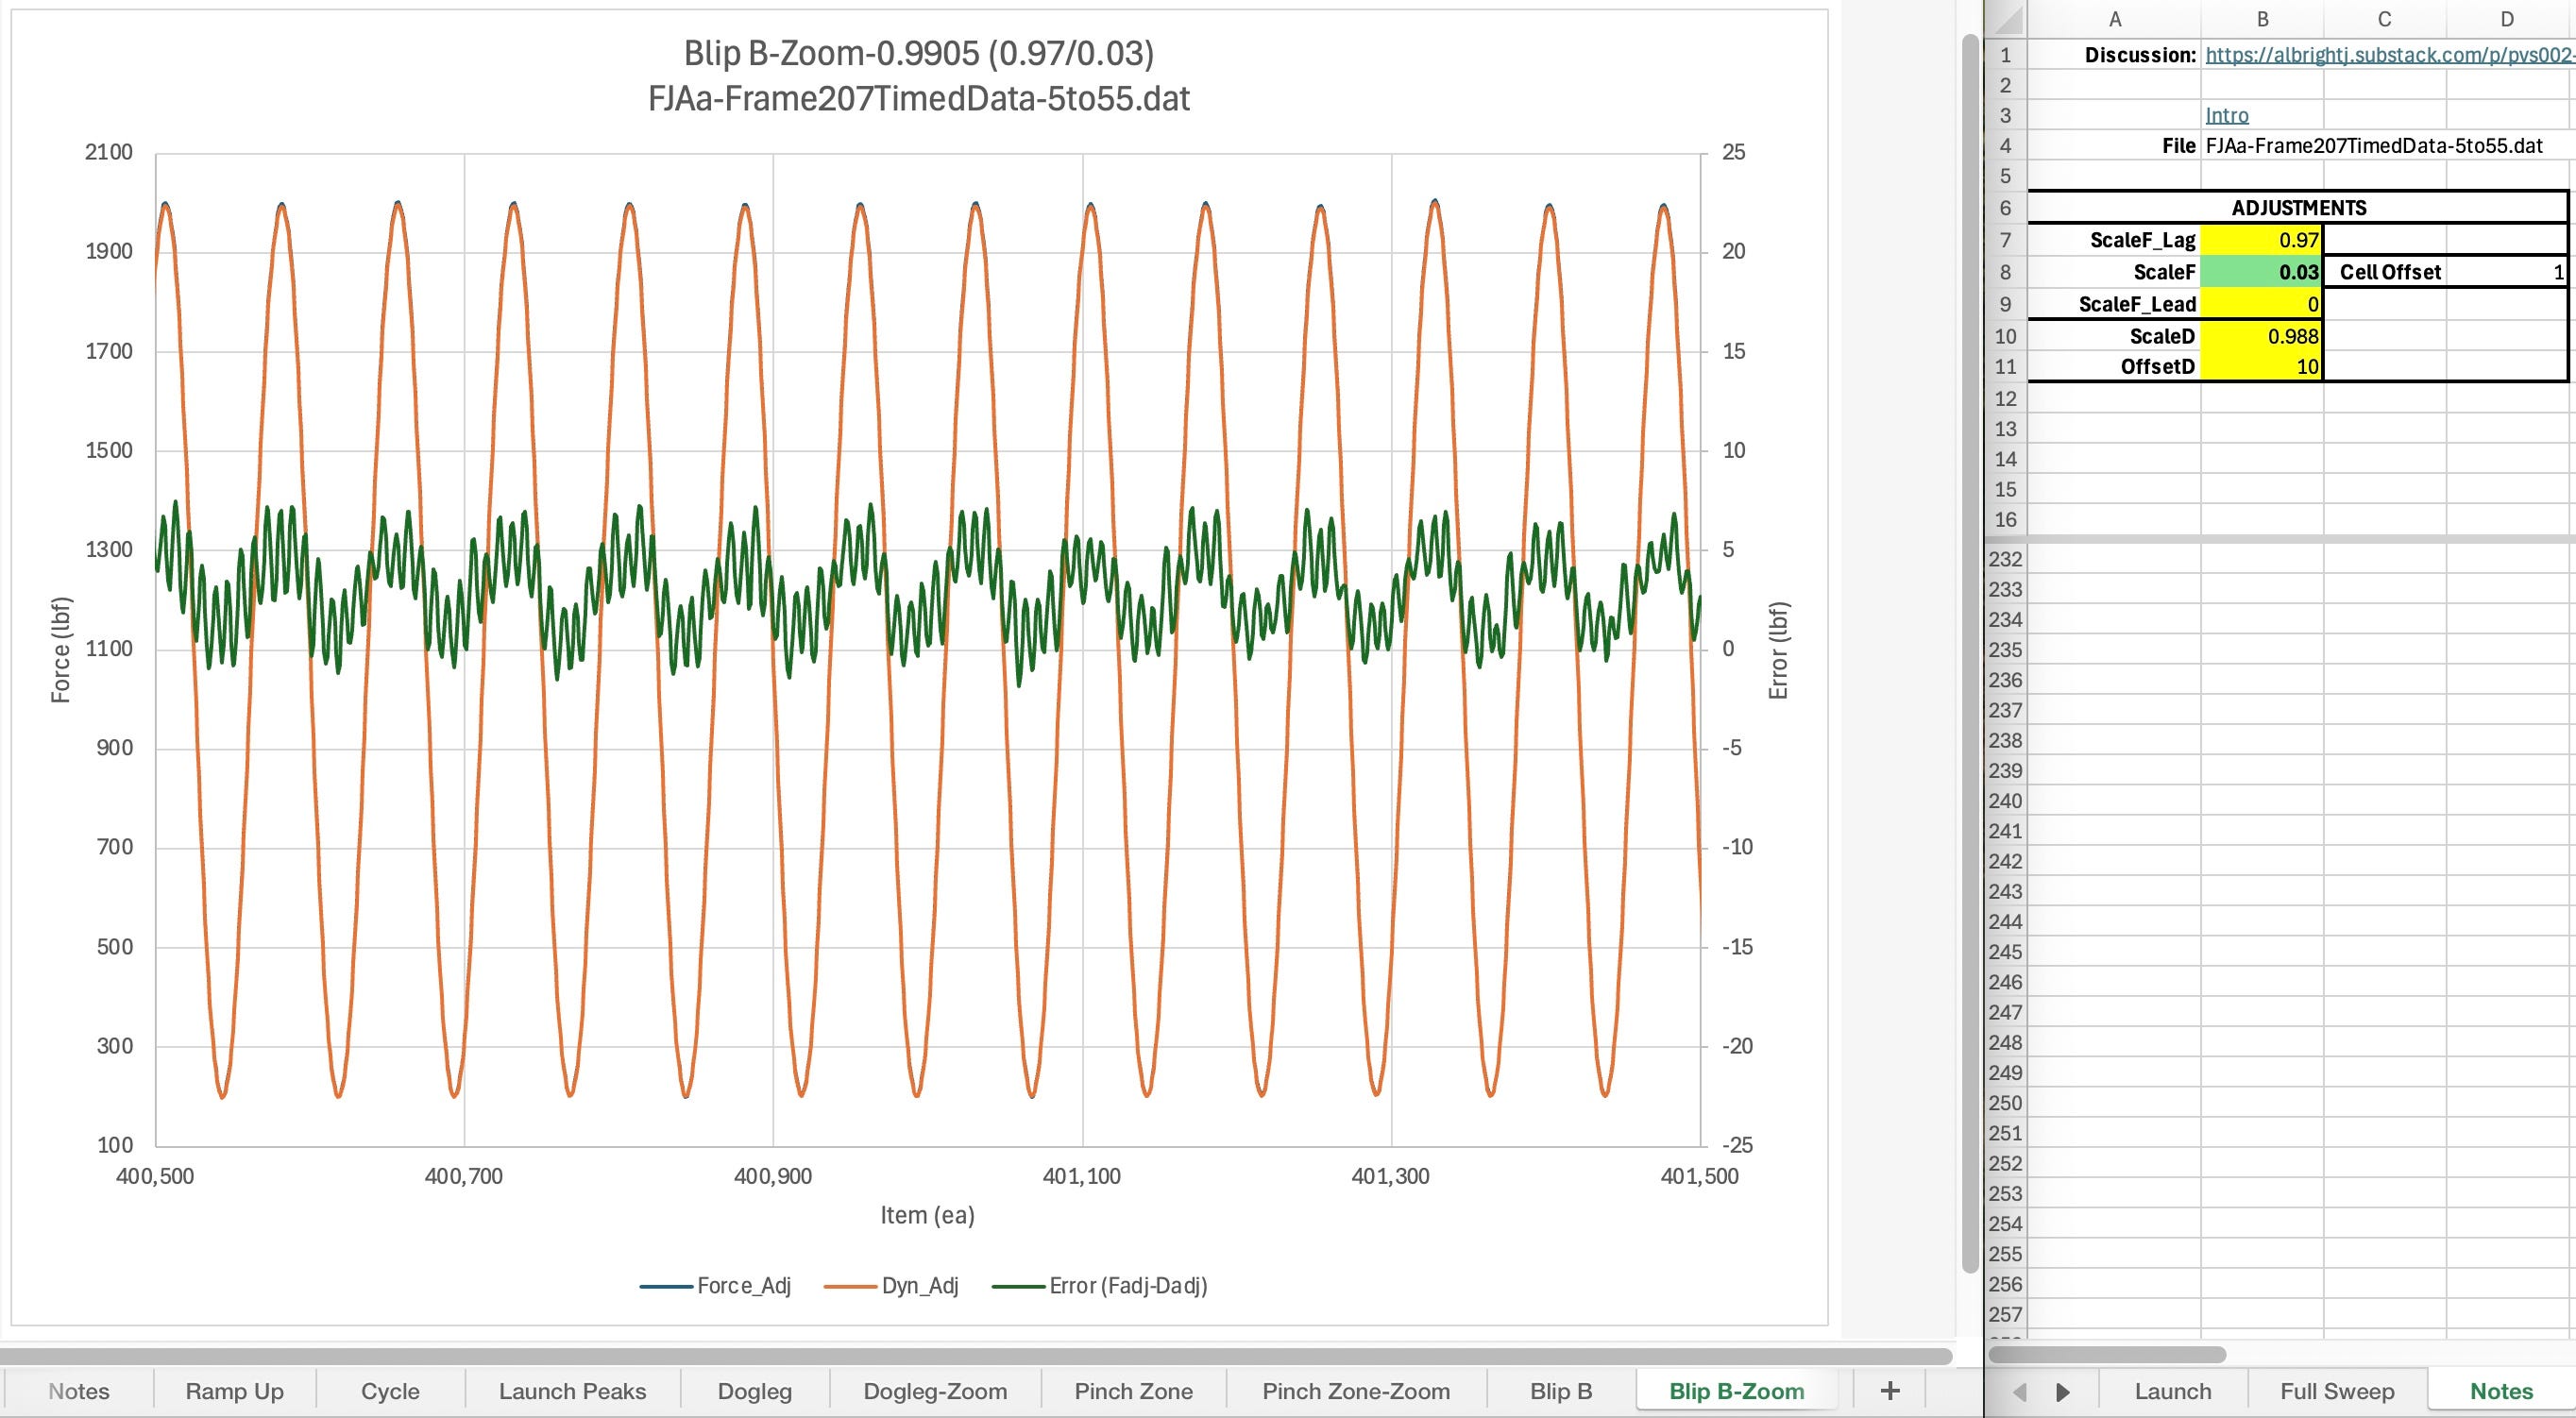
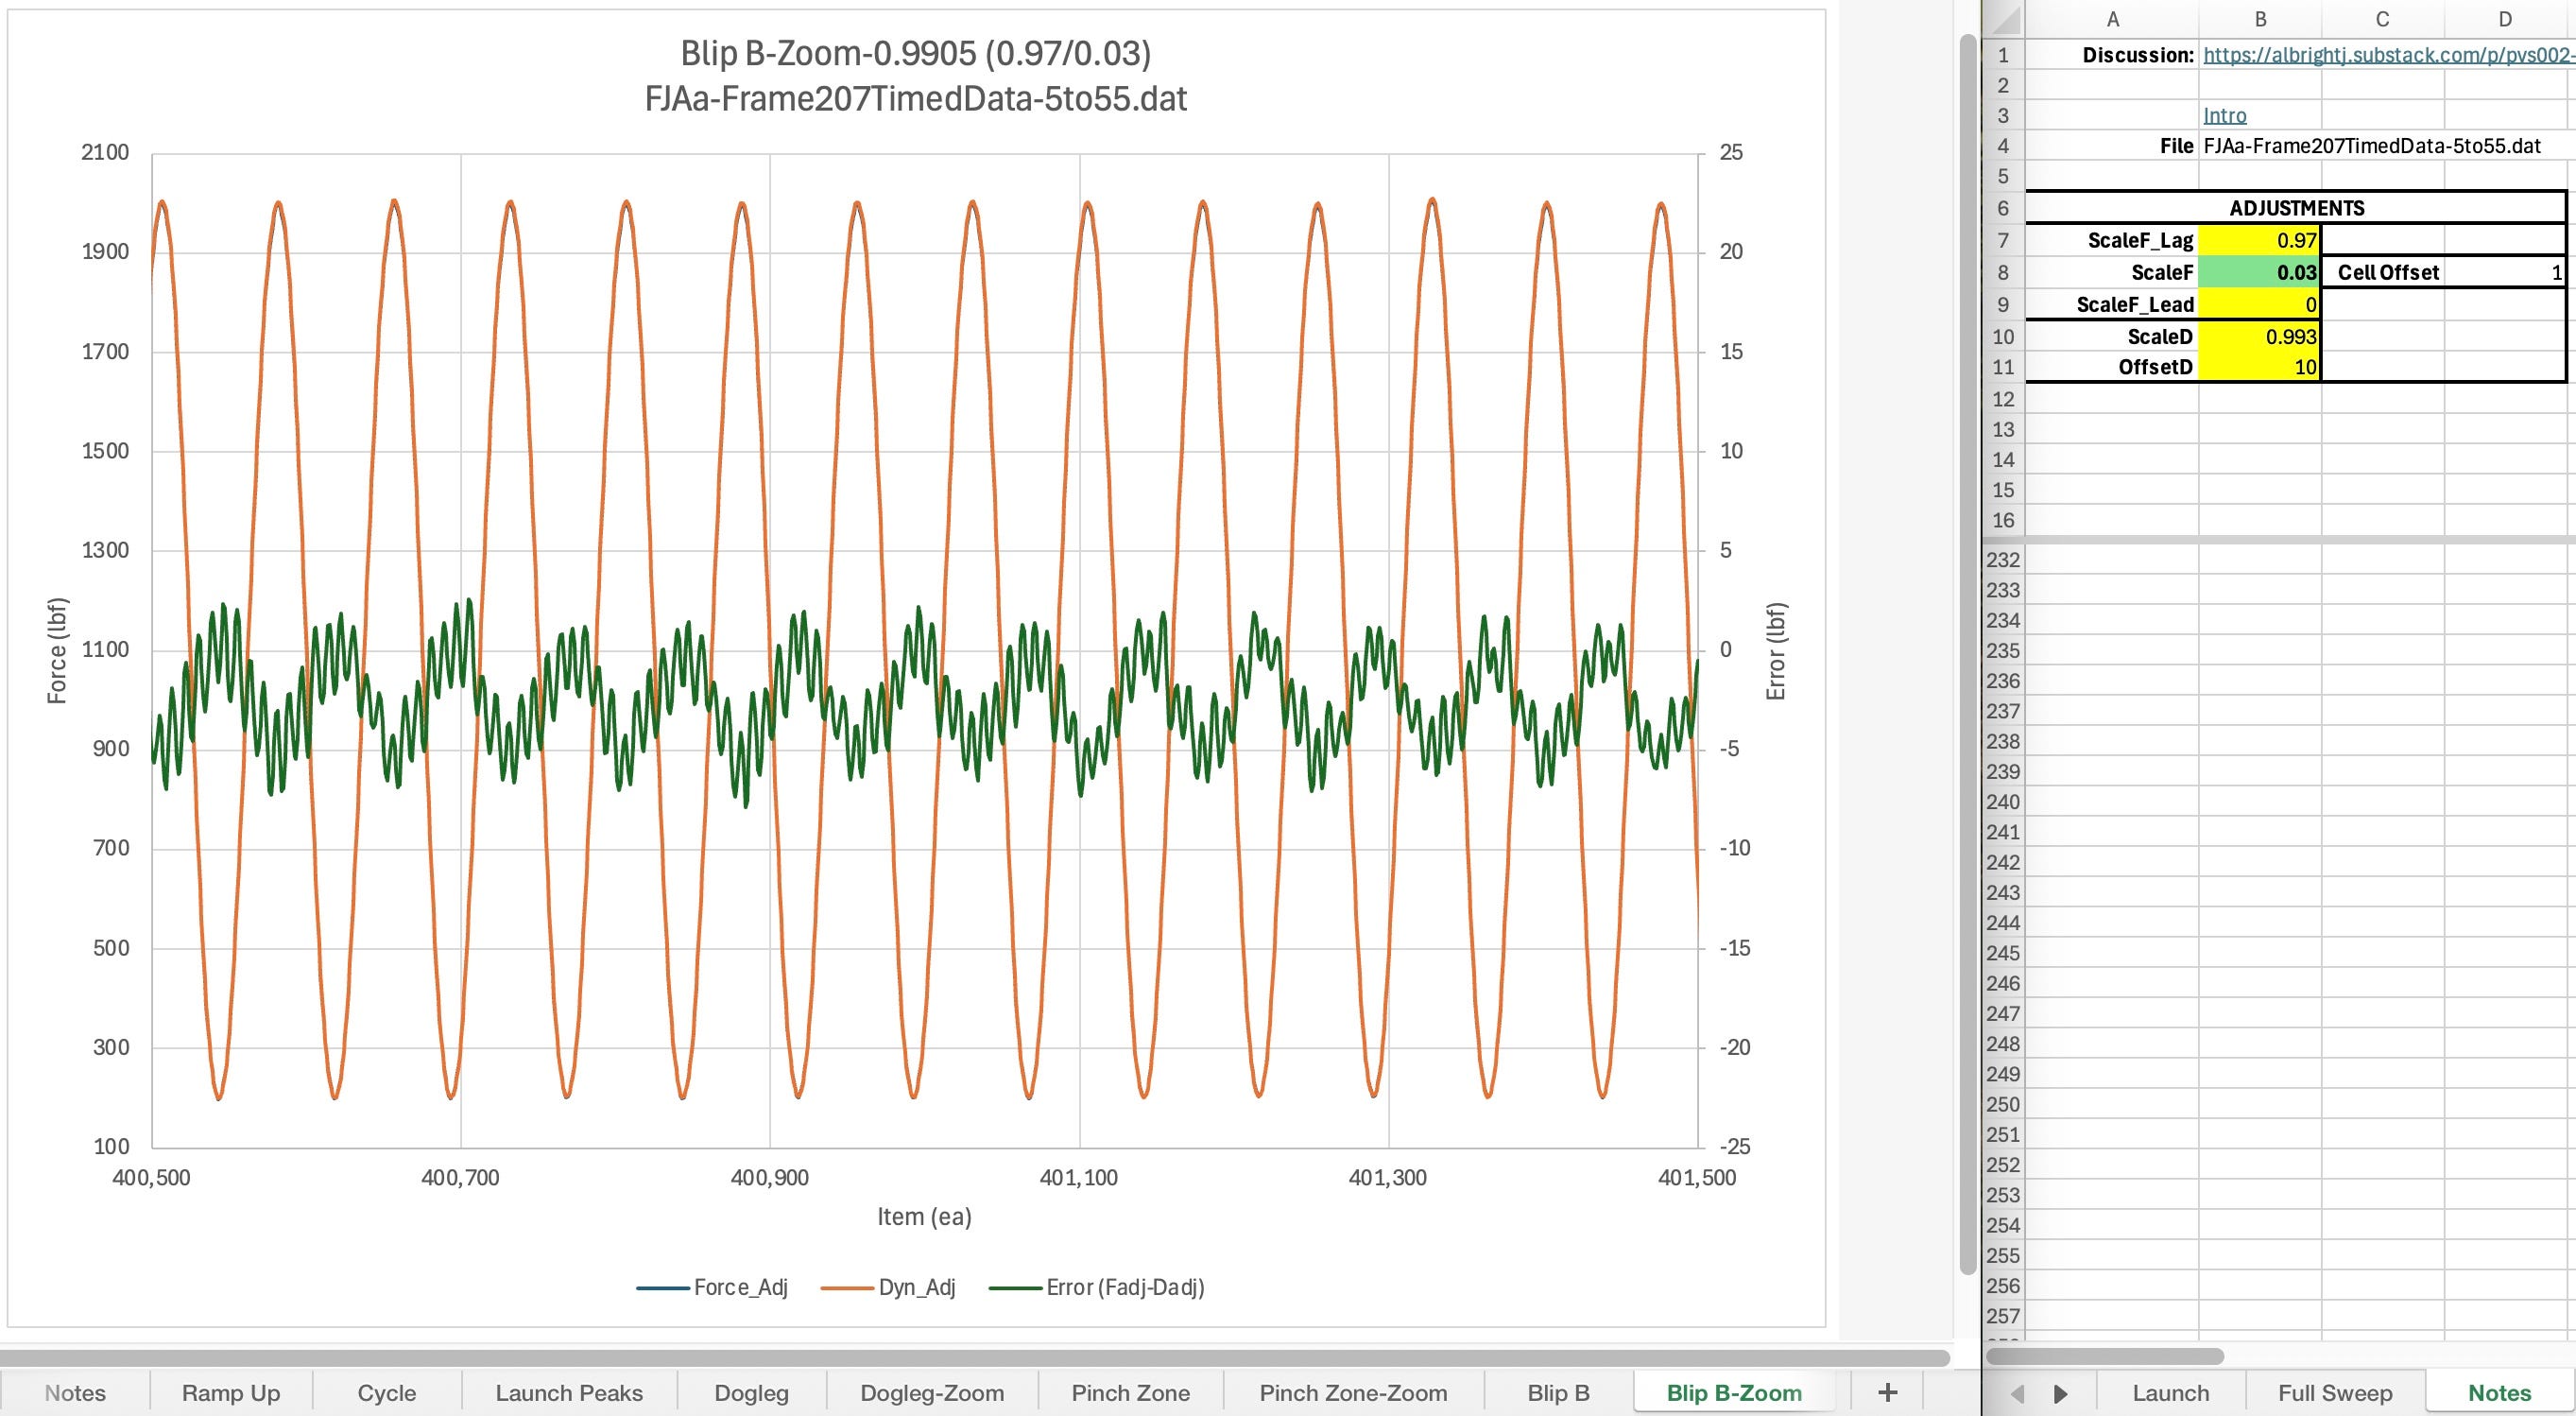
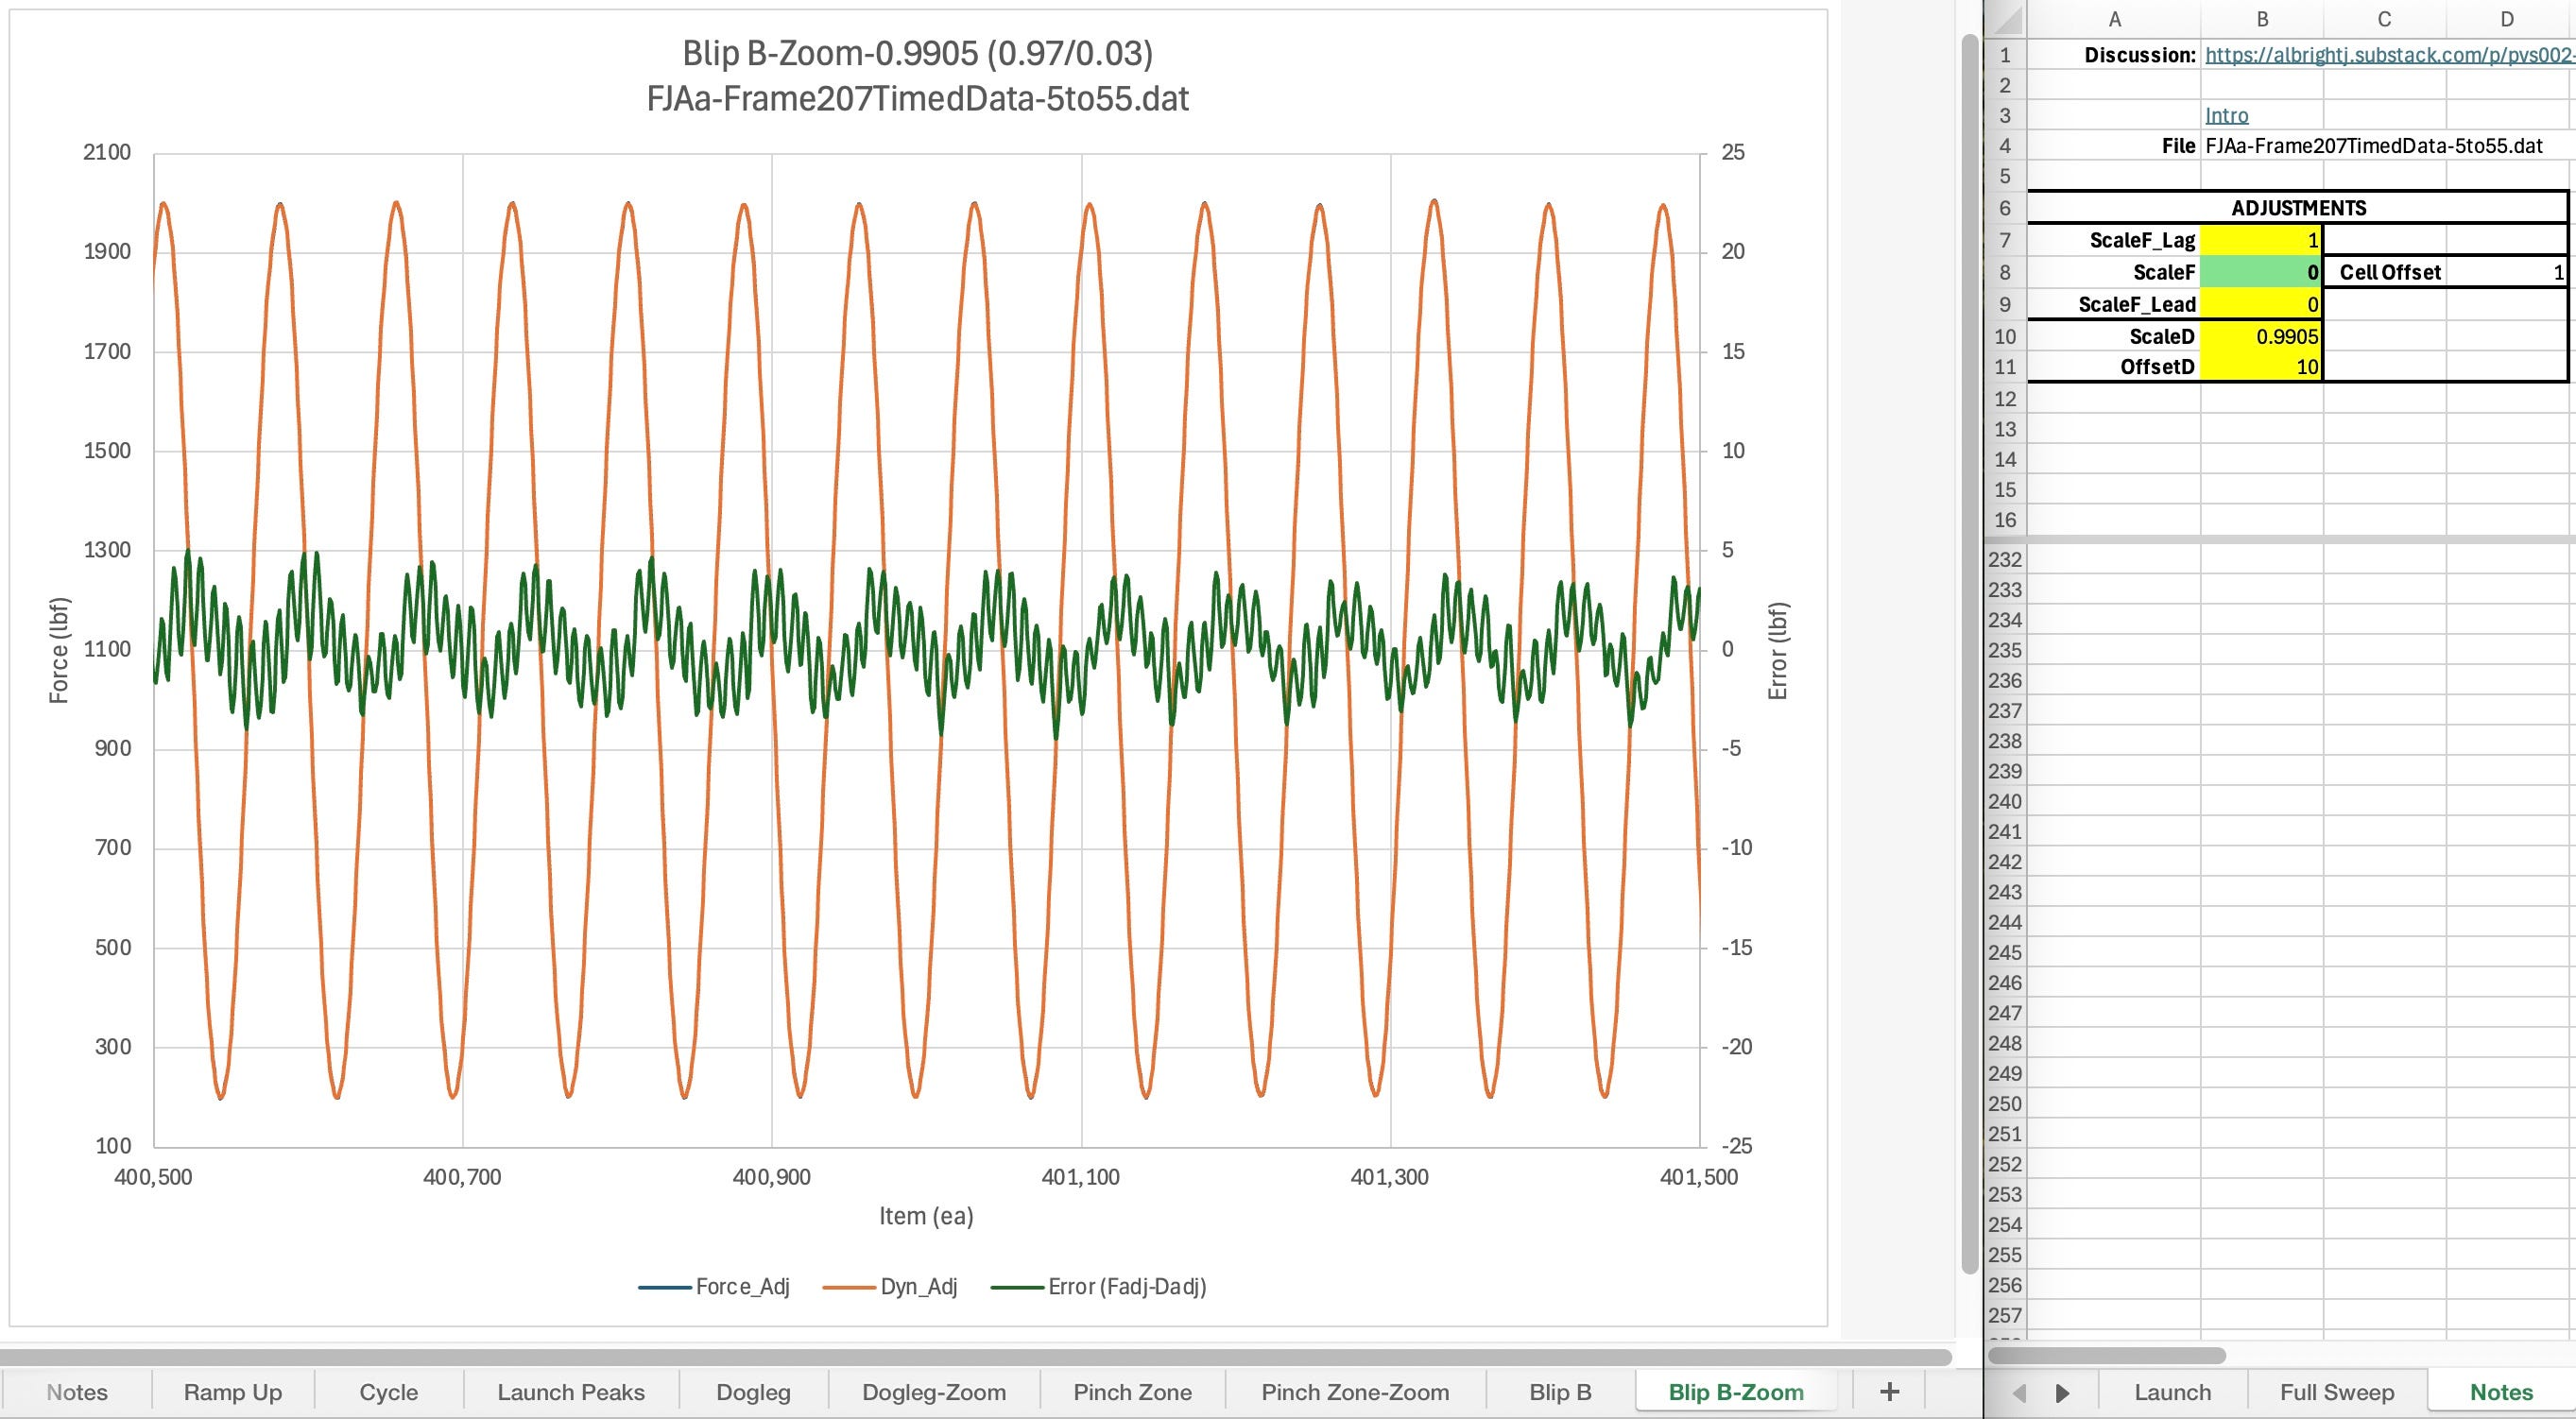
Blip B
Up / Comments / NextTBD
Discussion TBD
Note error frequency content (fjaa120021e).
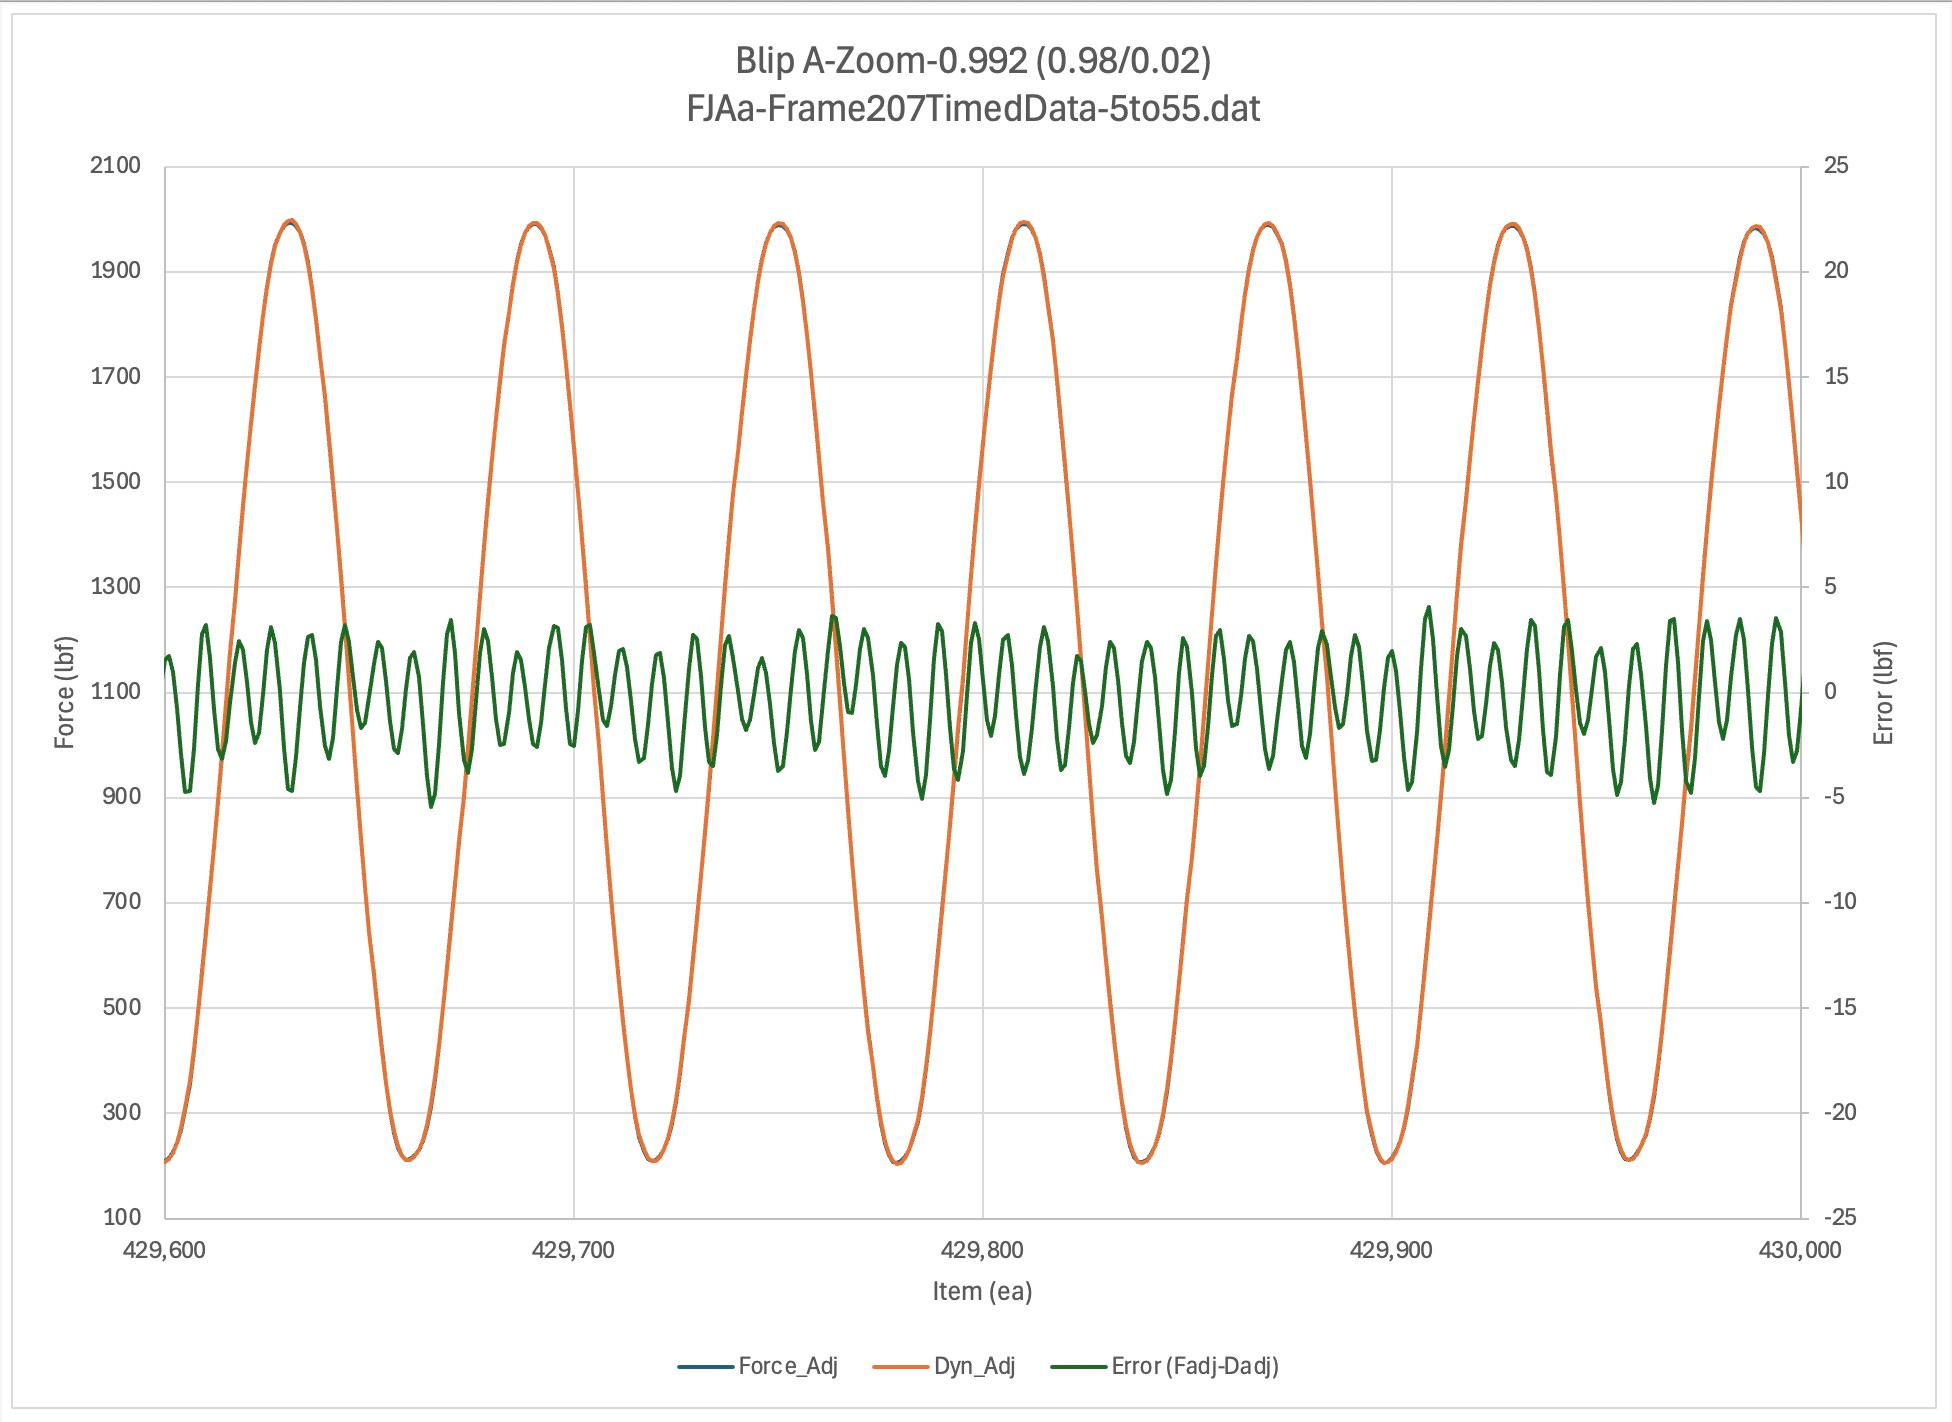
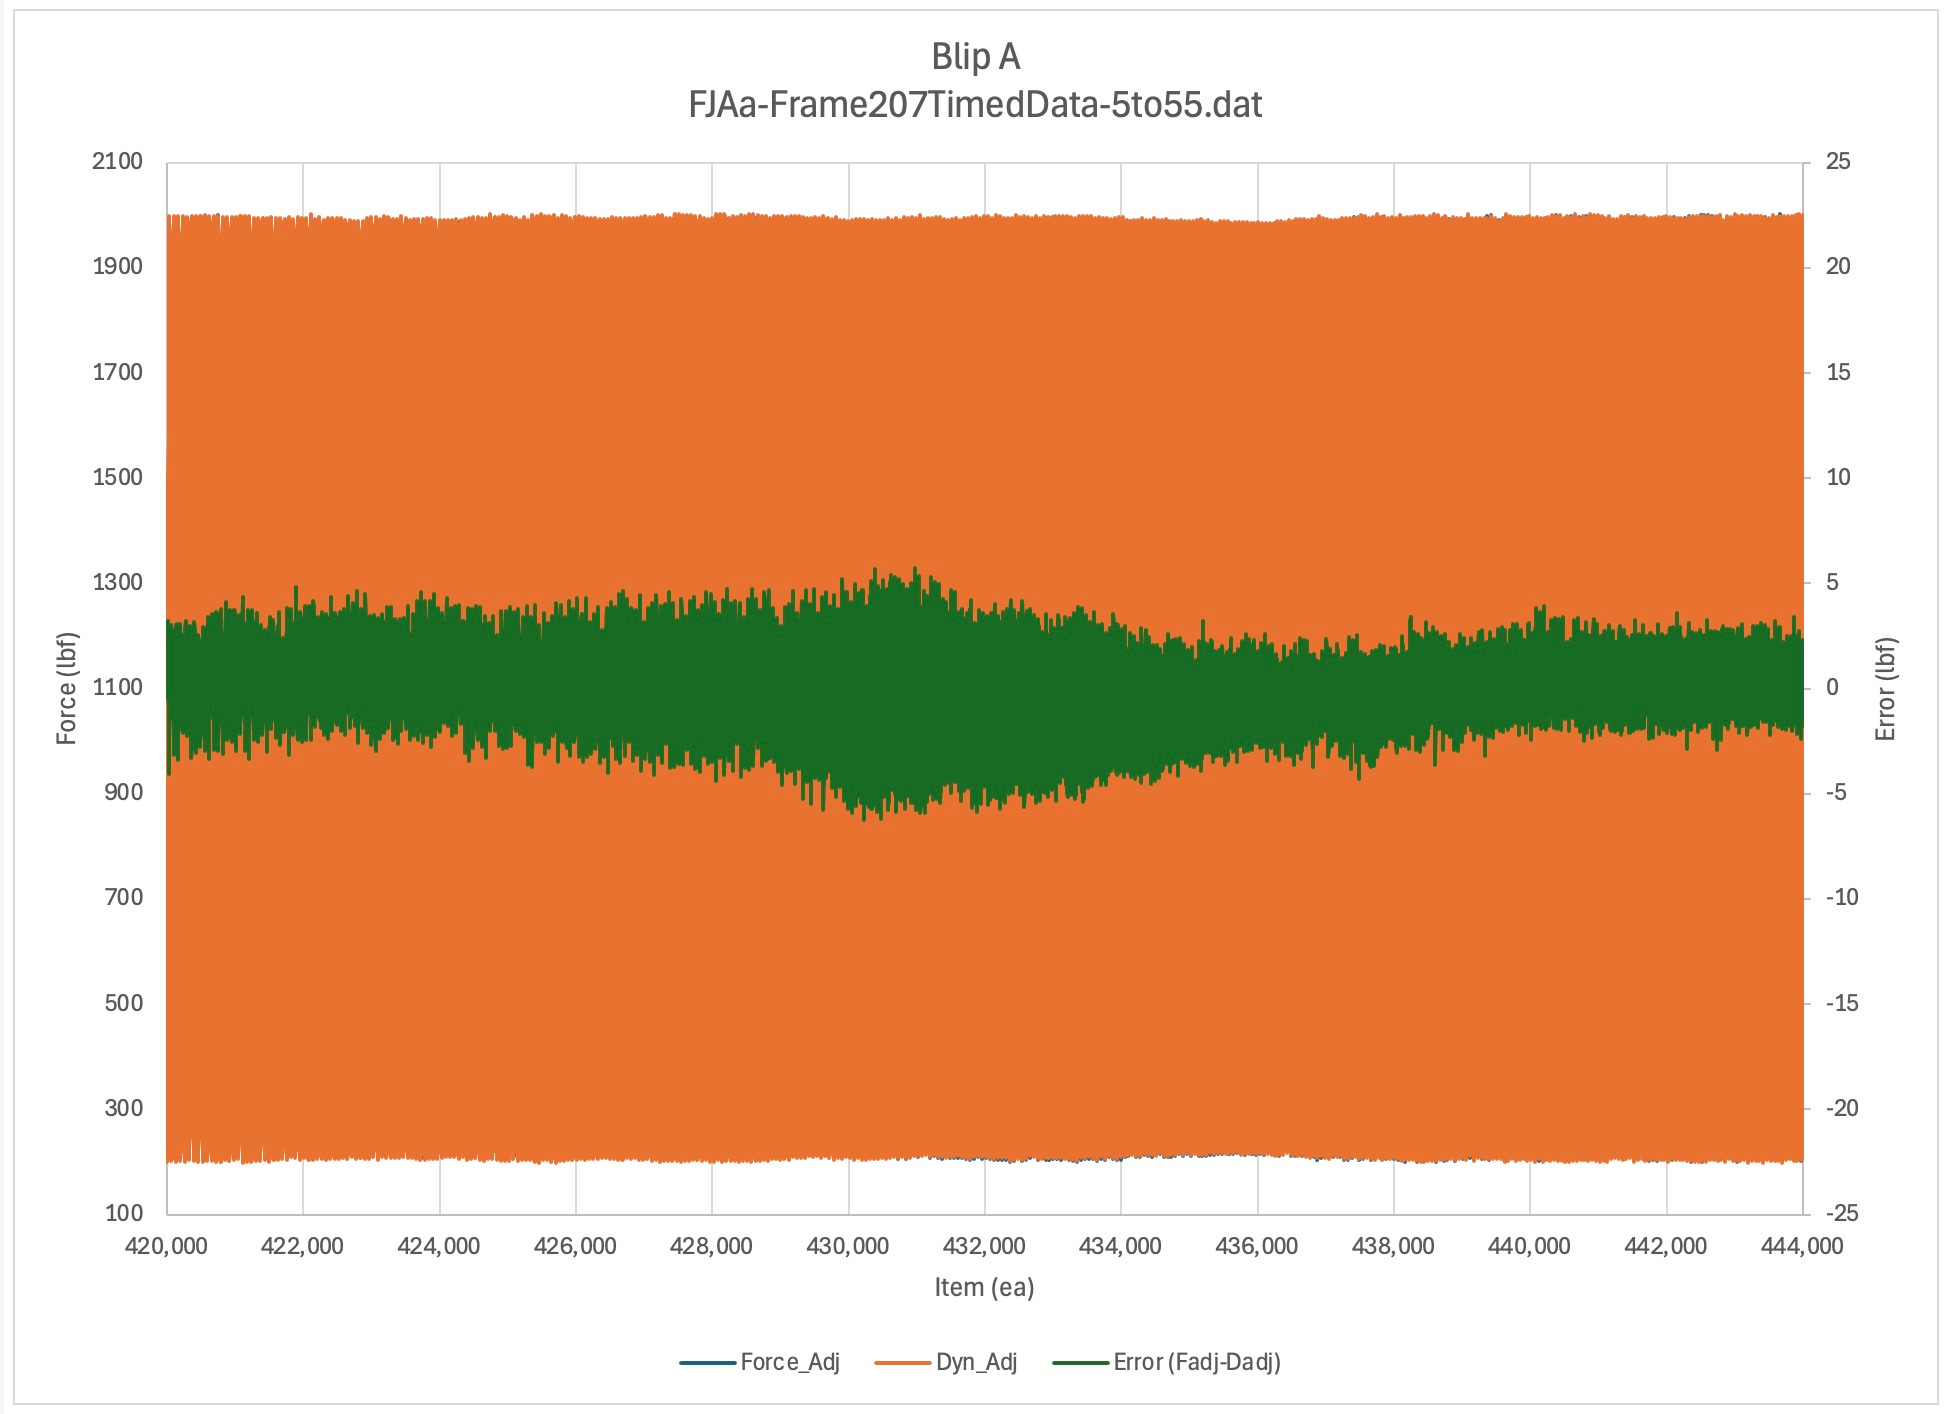
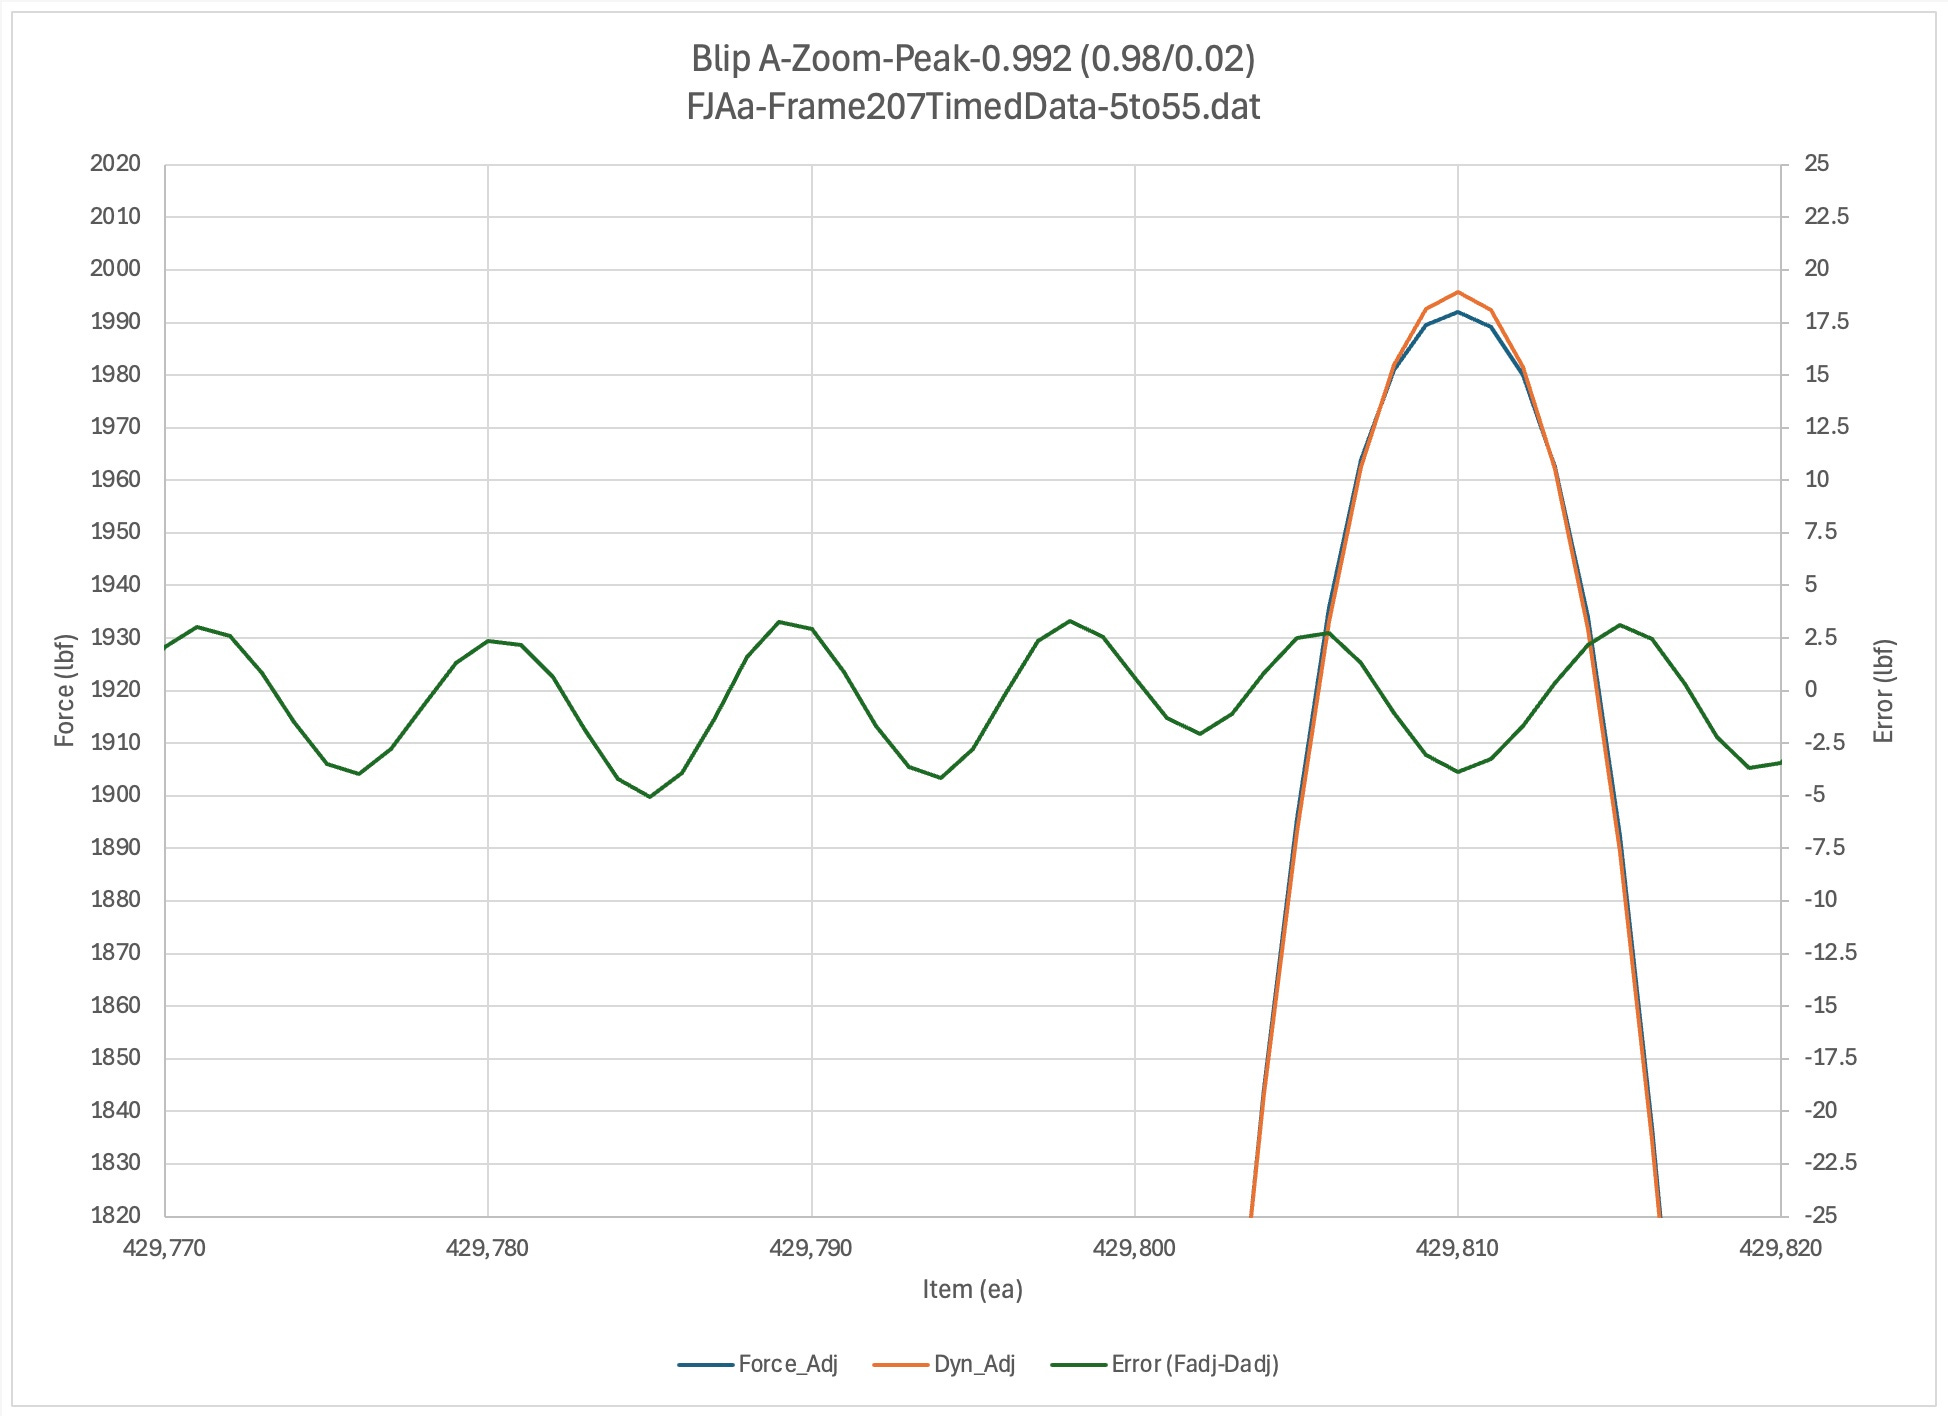
Blip A
Up / Comments / NextTBD
Discussion TBD
Note error frequency content (fjaa120021e).
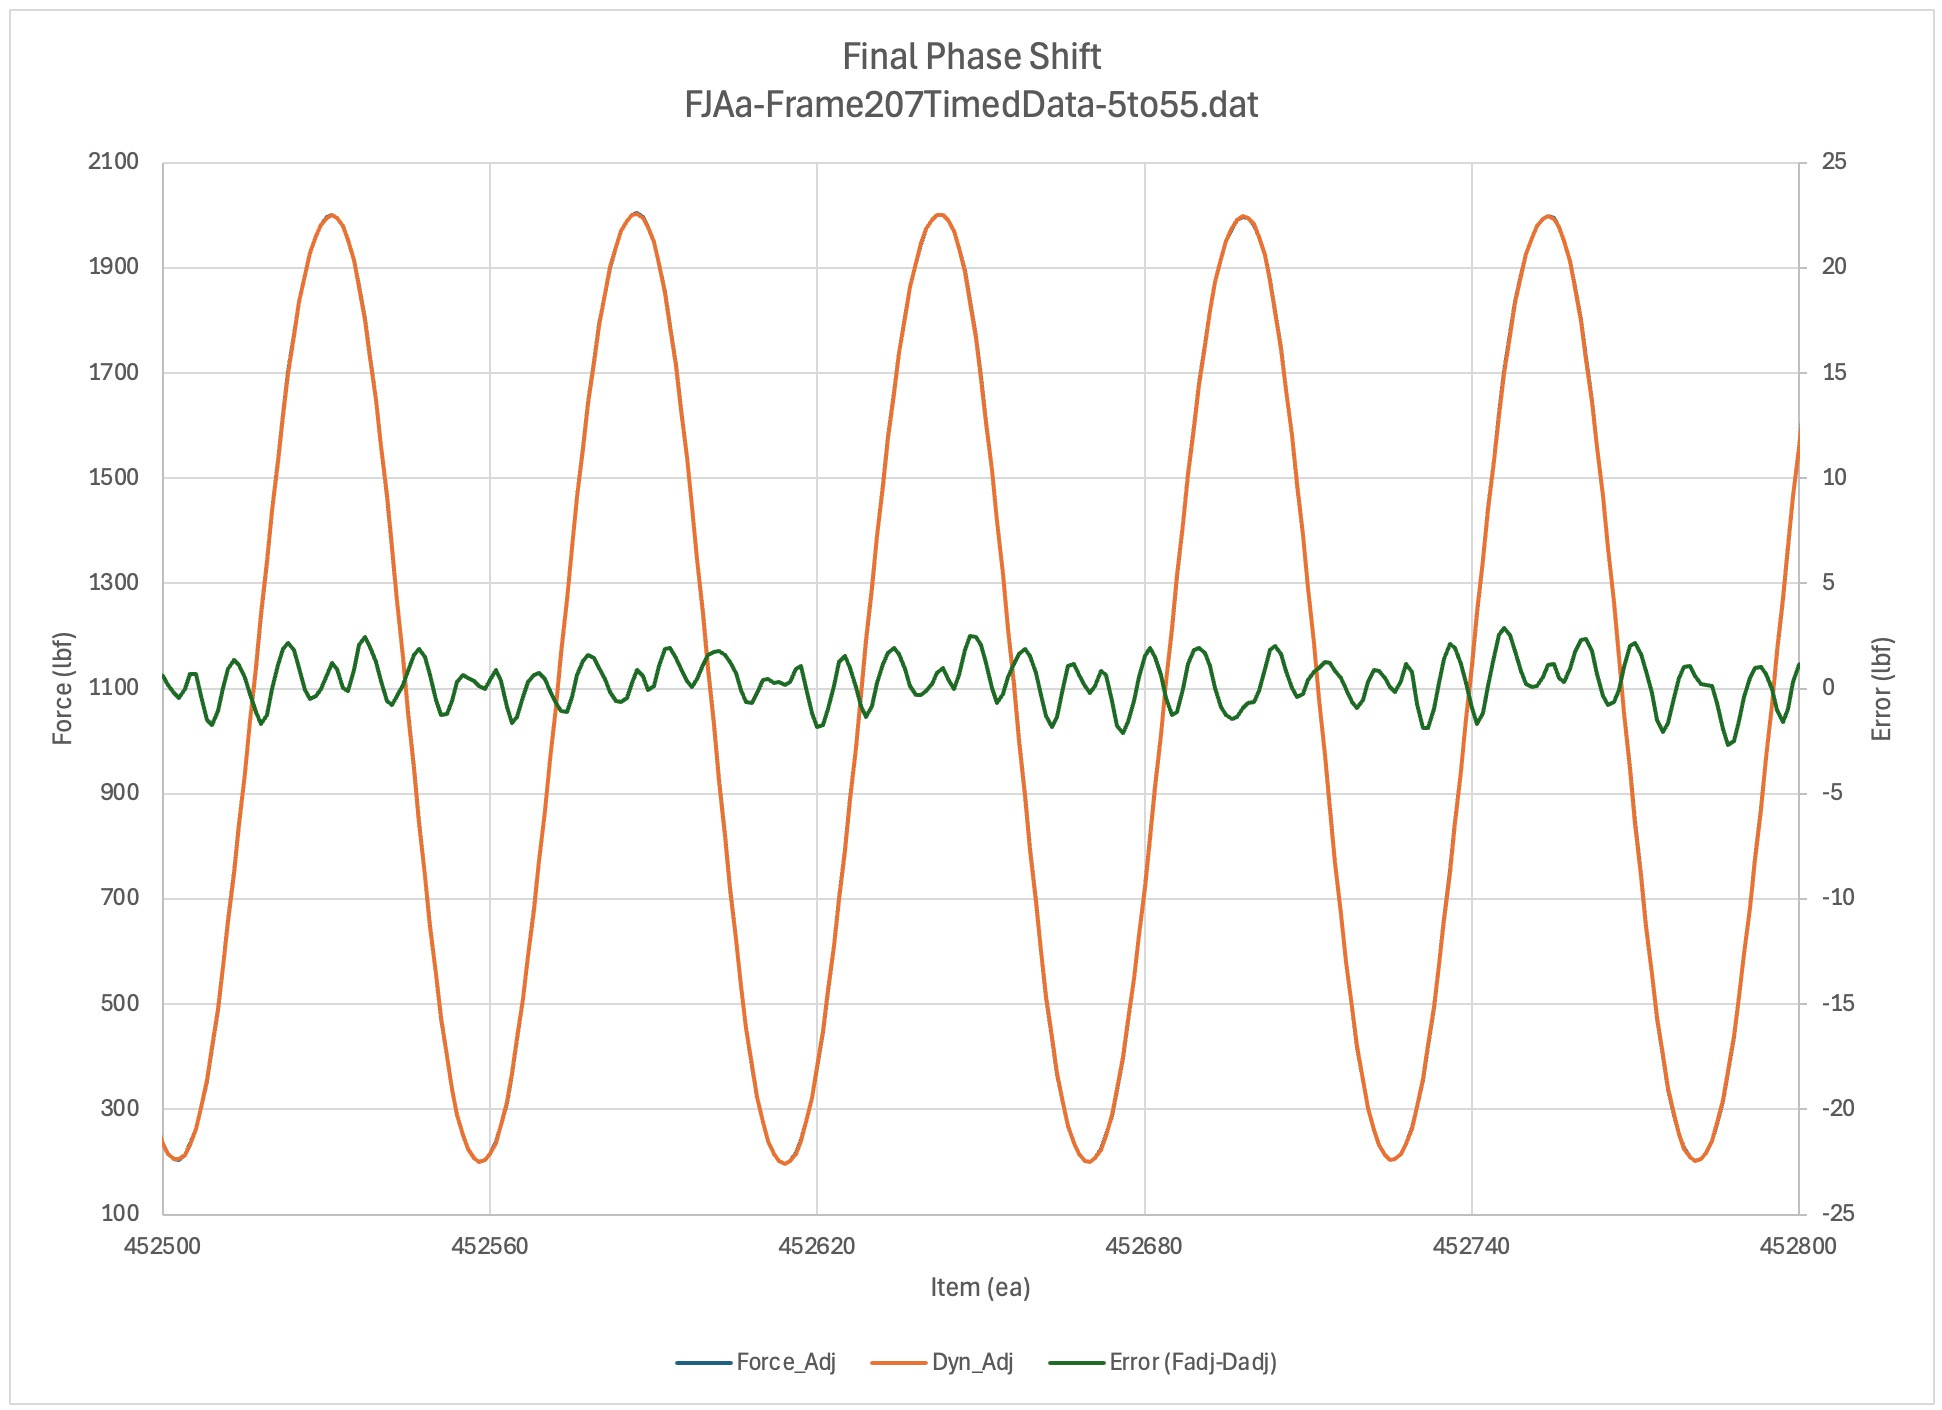
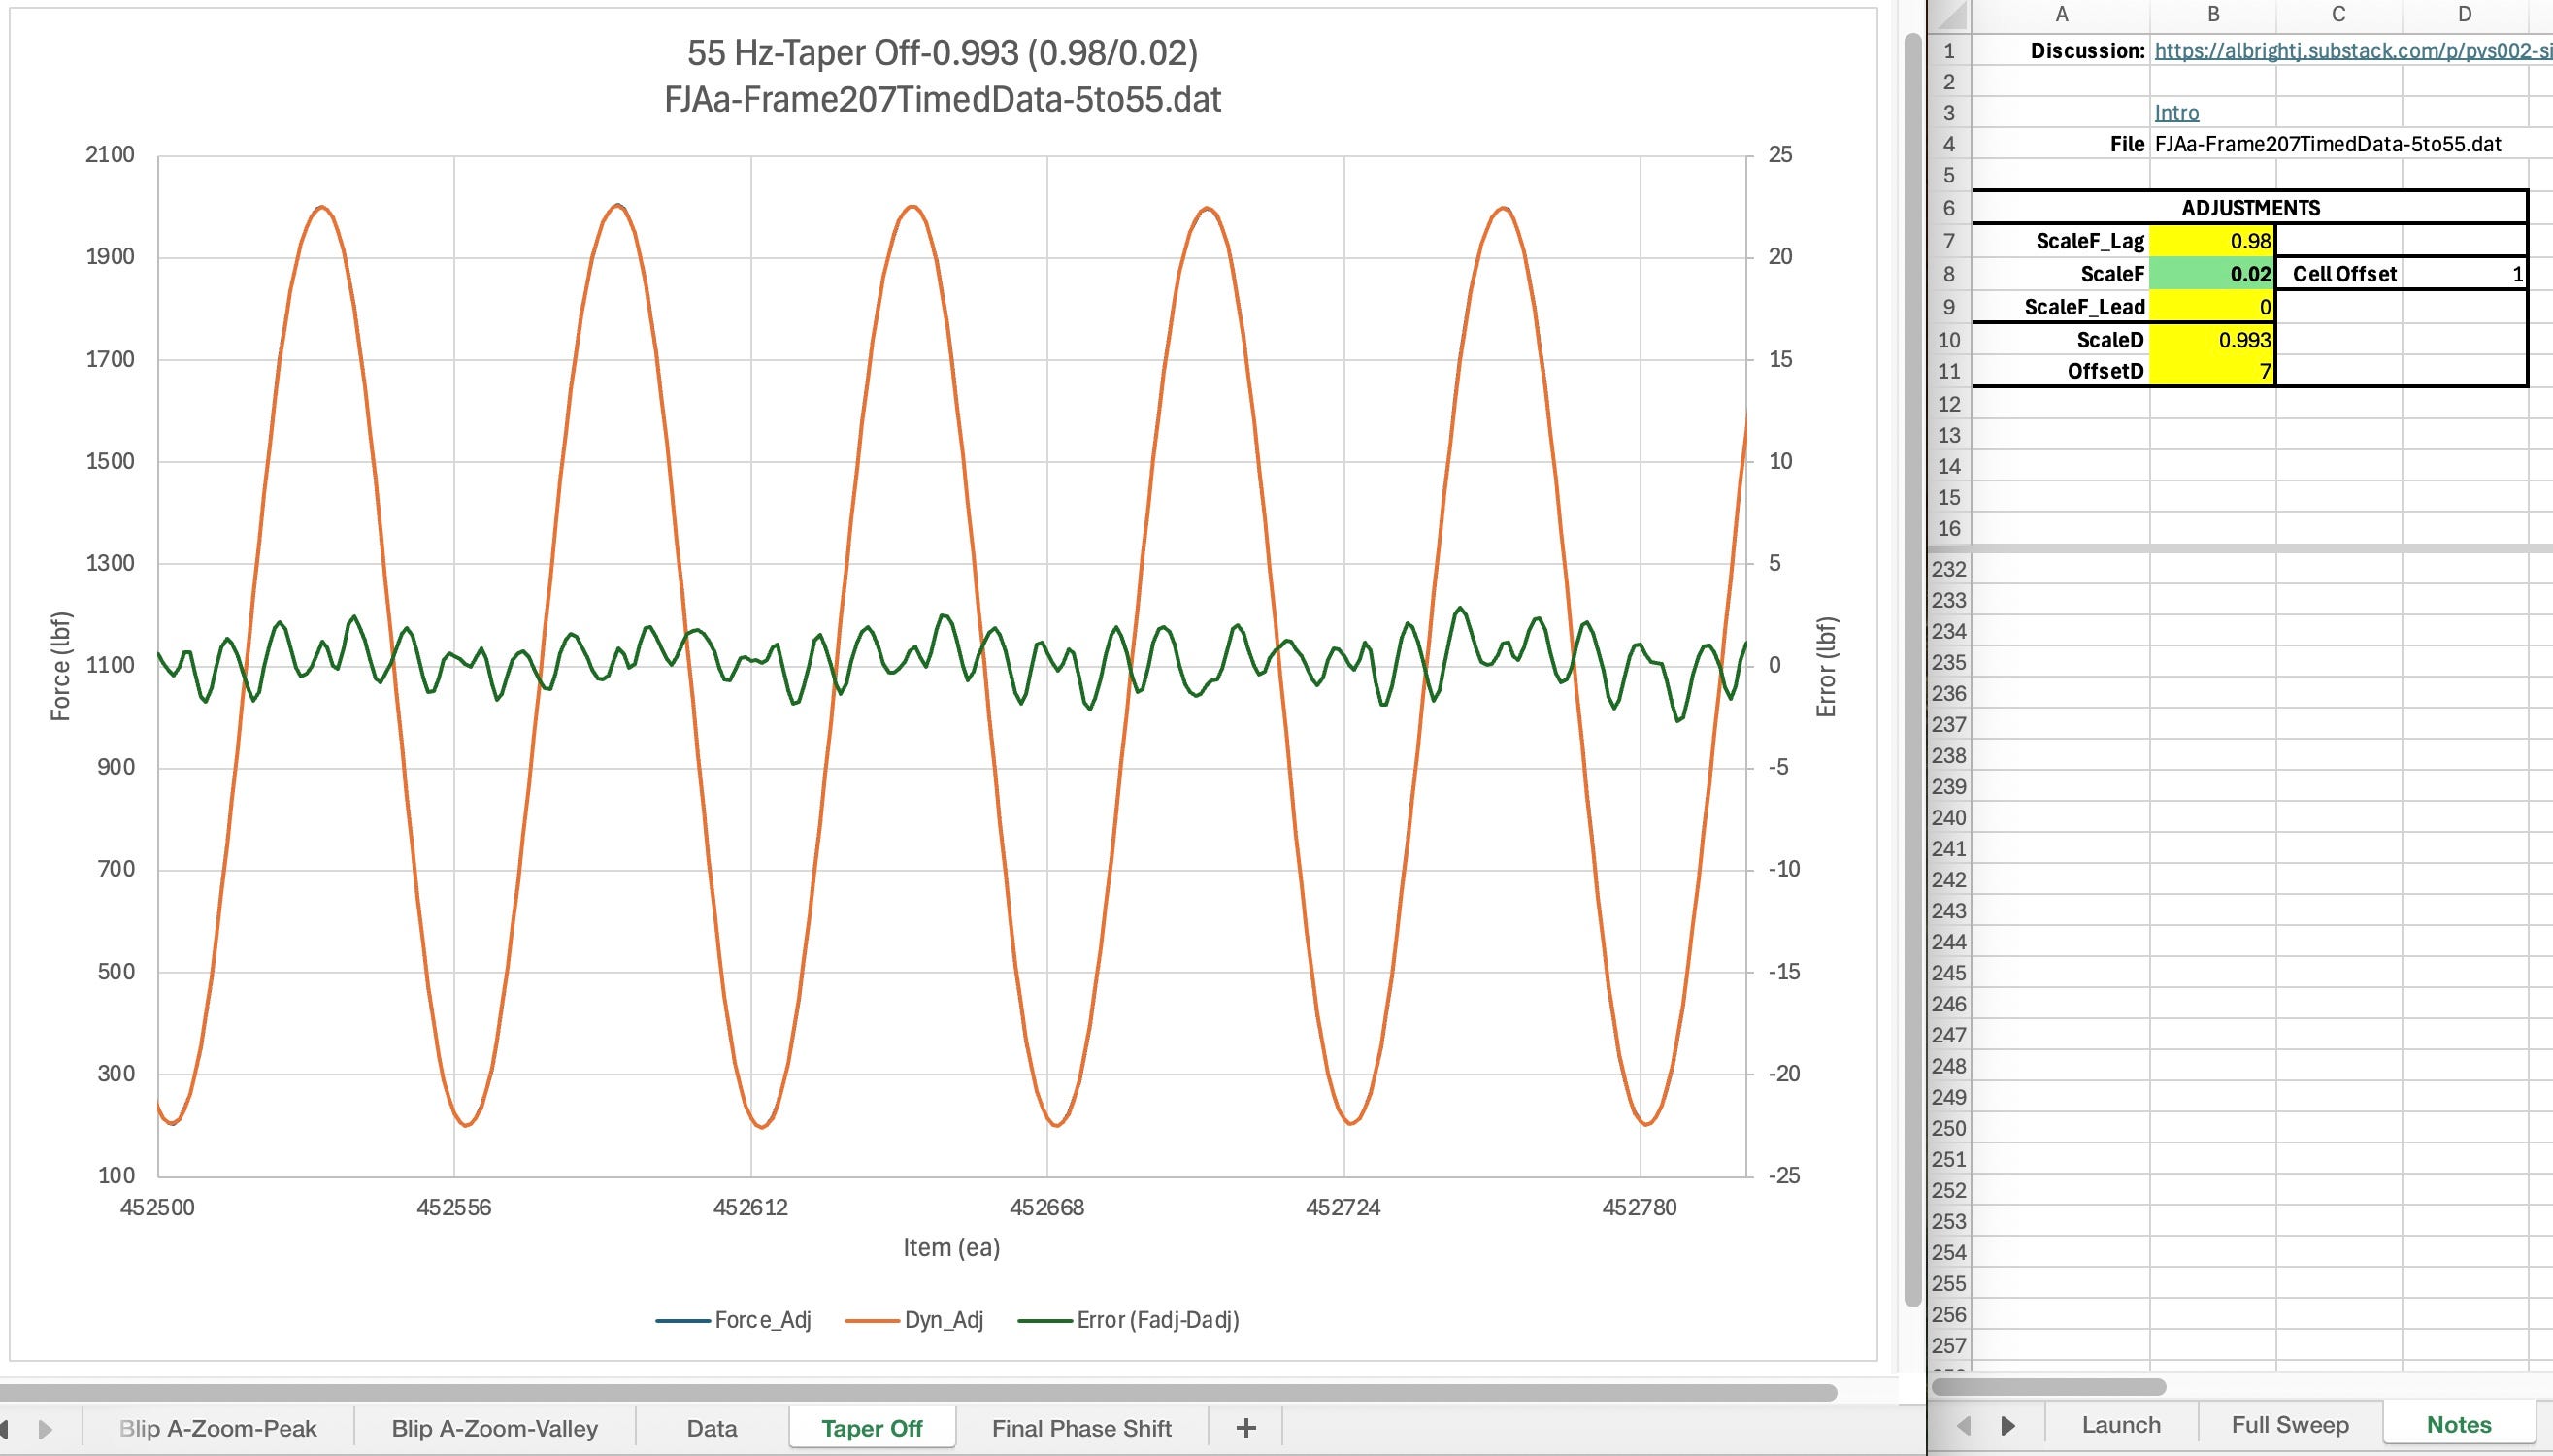
Final Phase Shift
Up / Comments / NextTBD
Discussion TBD
Note error frequency content (fjaa120021e).
Figures-Regions
Up / Comments / Figures-Zoom , Outline
This section gives a broader view of the regions being studied. The list below allows you to jump directly to the region of interest.
Launch Region
Up / Comments / NextTBD
This is the beginning of the test. Note that the error trace is not flat, with the noise centered around 0, over the full trace. Ig is only relatively flat over the last third of this region. How is this possible? (fjaa120021a)
Dogleg Region
Up / Comments / NextTBD
Discussion TBD
Pinch Zone Region
Up / Comments / NextTBD
Discussion TBD
Blip B Region
Up / Comments / NextTBD
Discussion TBD
Blip A Region
Up / Comments / NextTBD
Discussion TBD
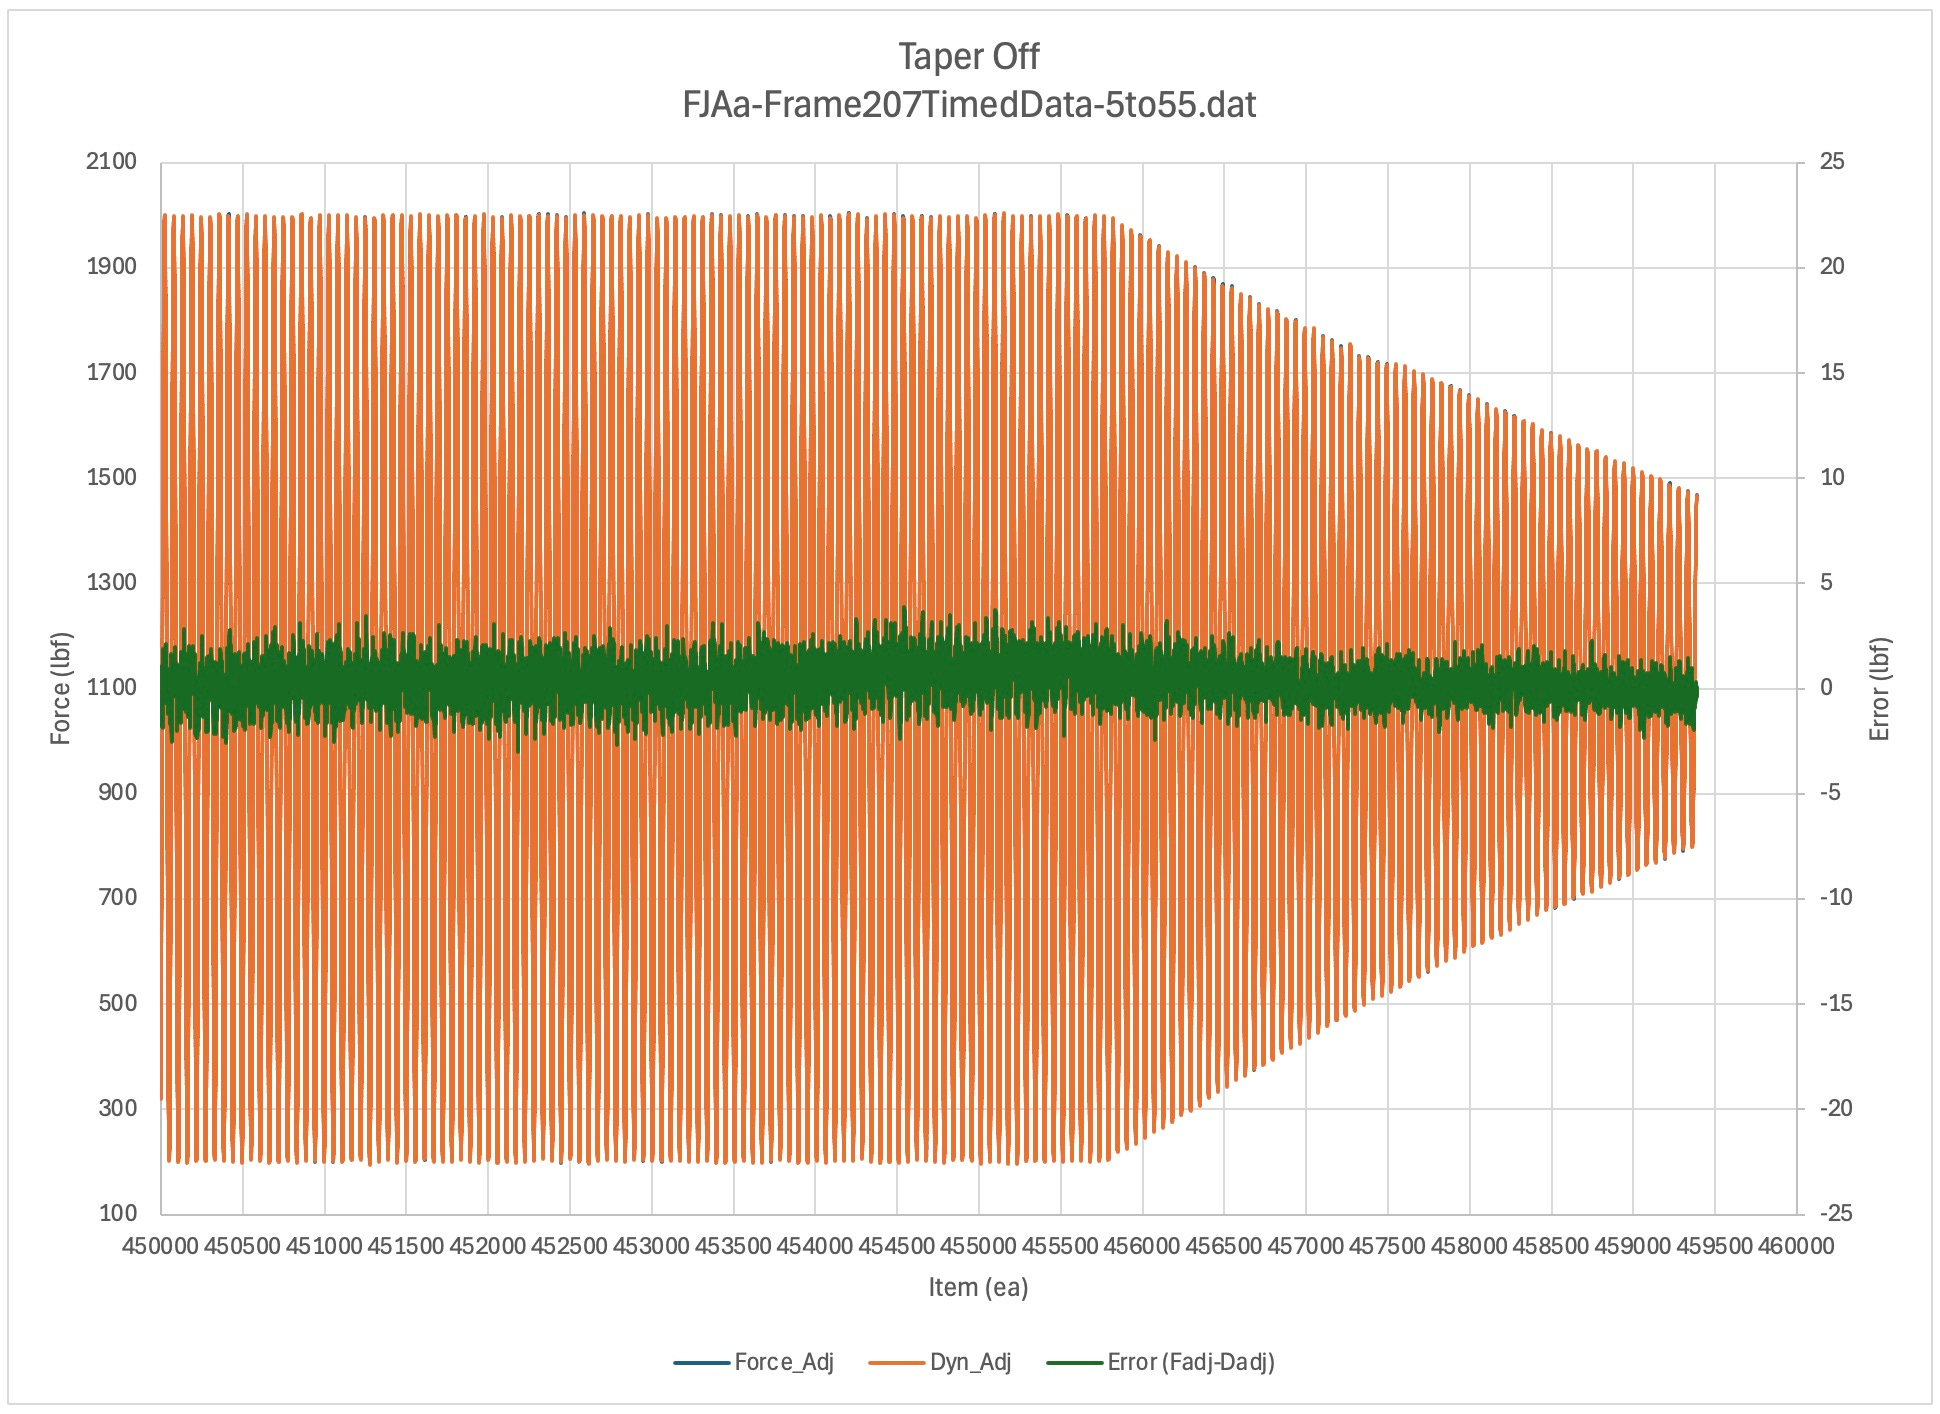
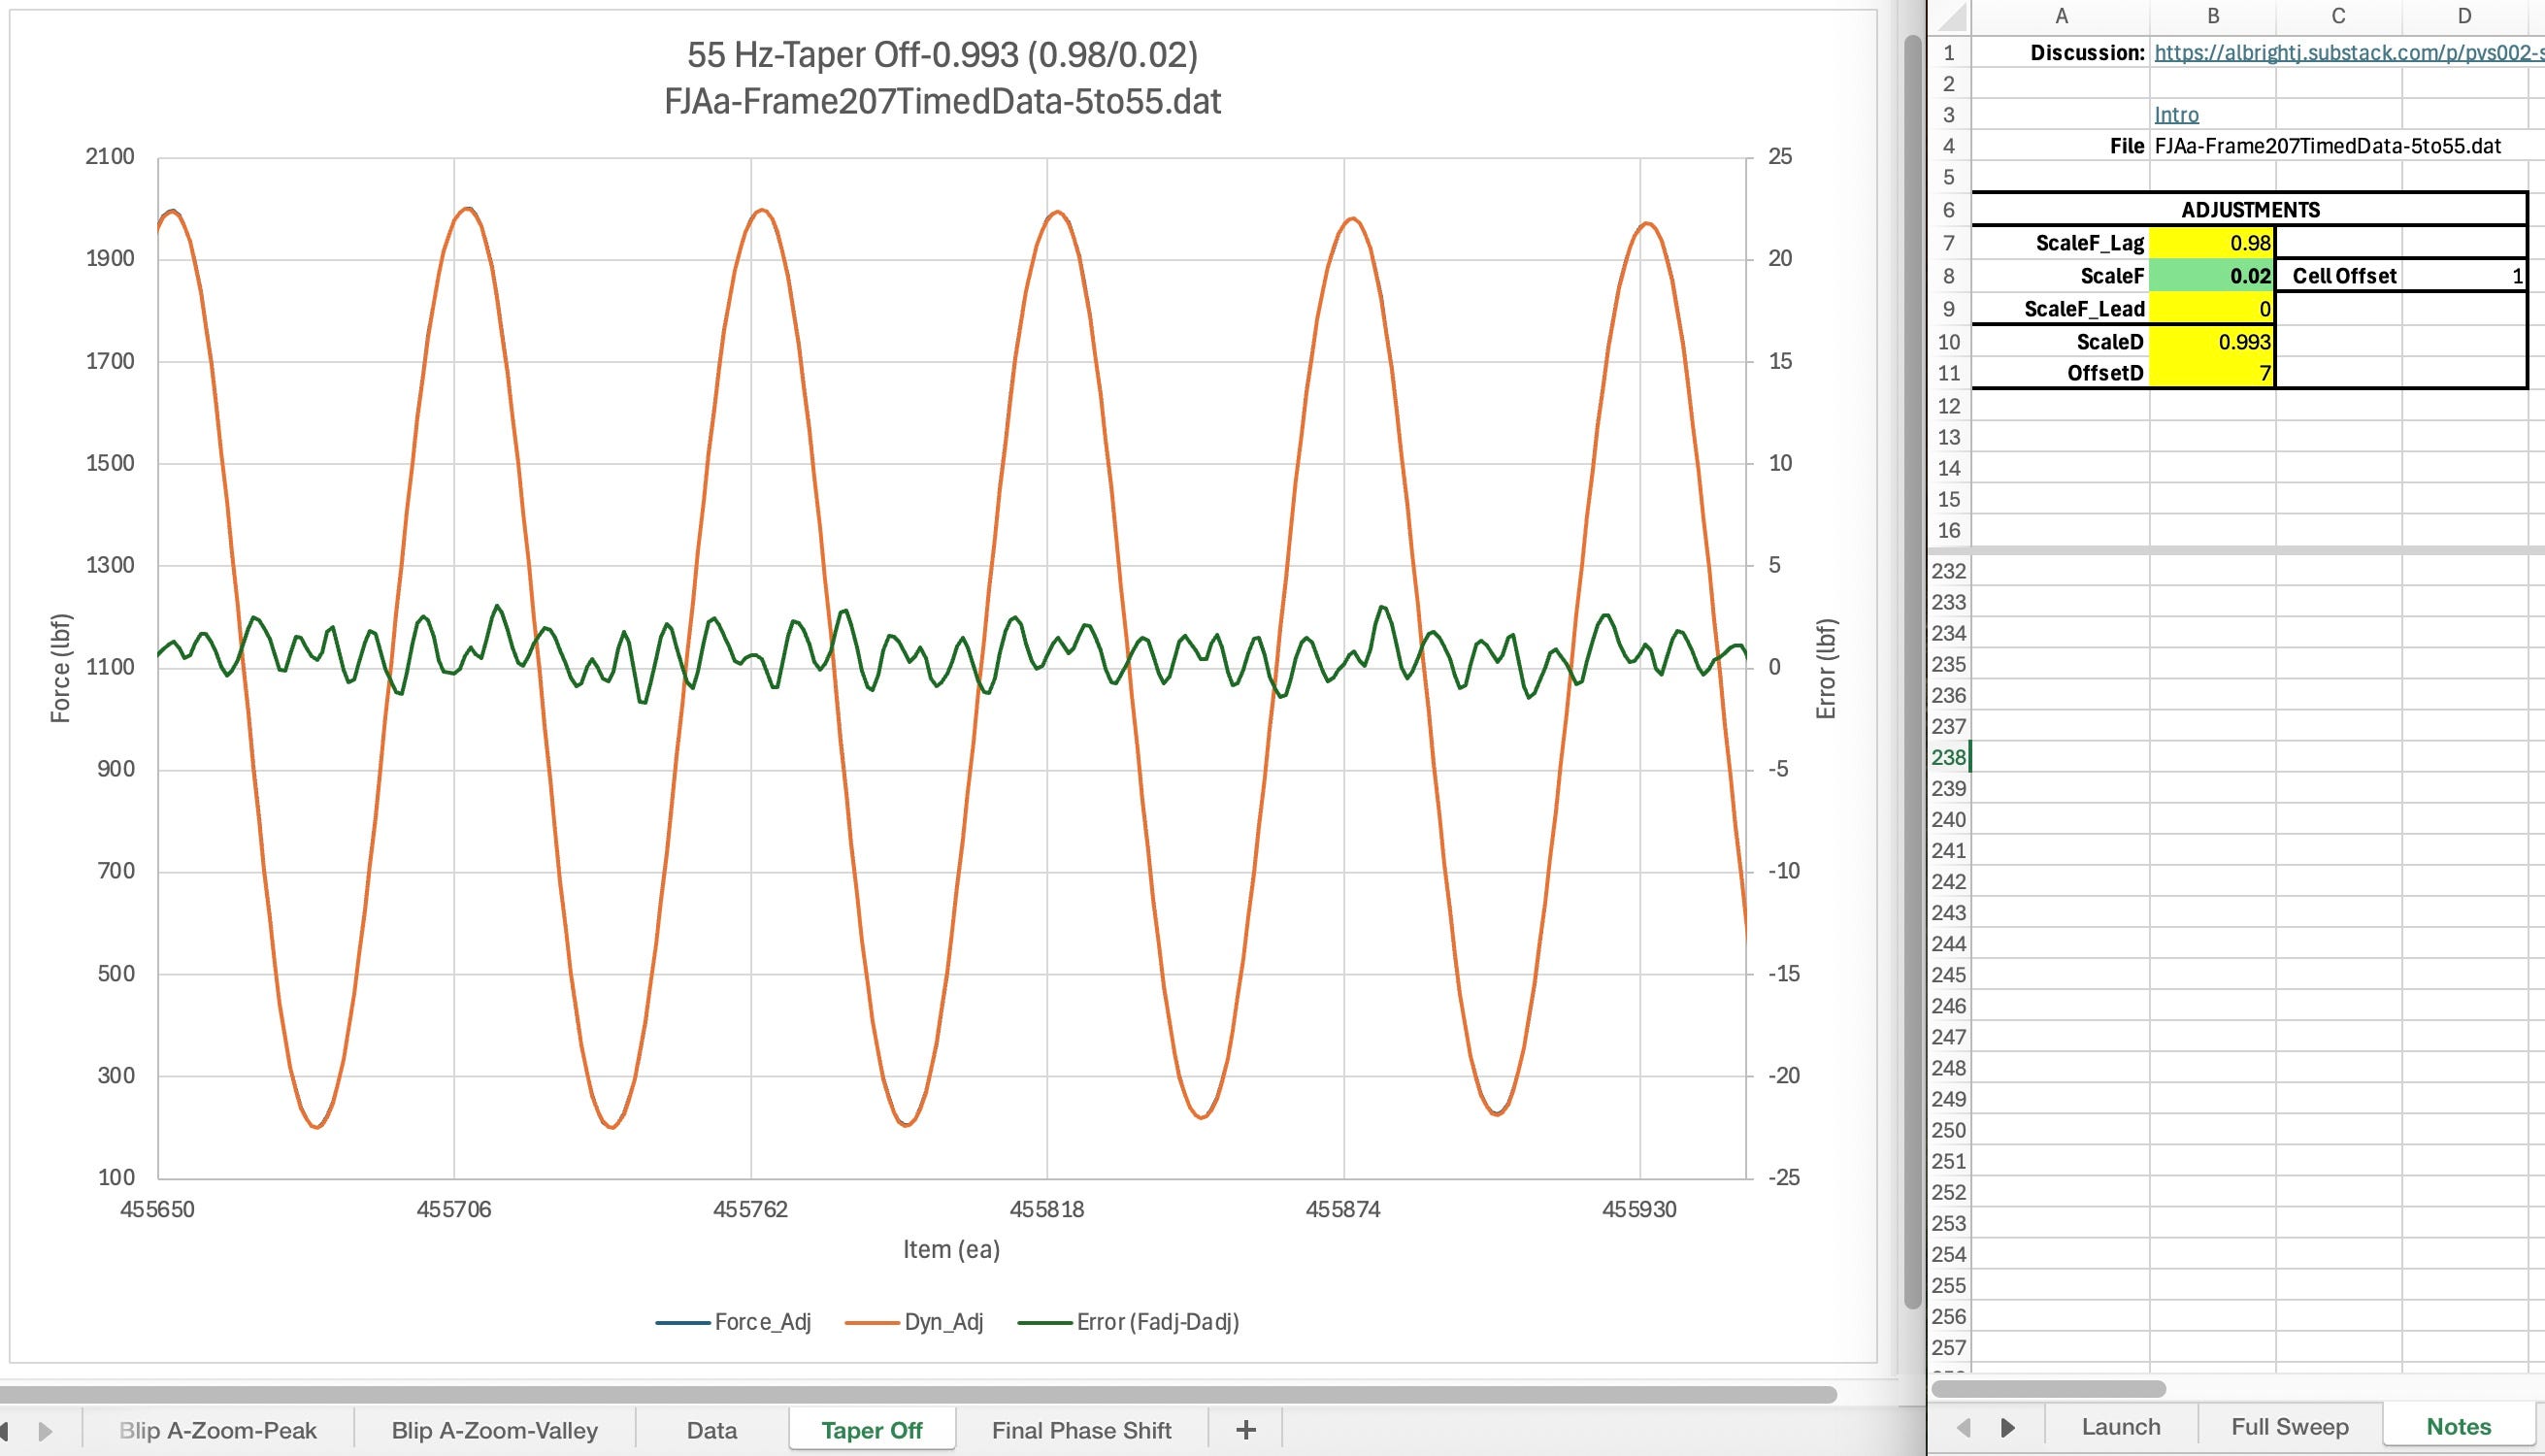
Taper Off Region
Up / Comments / NextTBD
Discussion TBD
Features and Methods
Up / Comments / Summary , Outline
Discussion TBD
Subsection List
Settings Table
Up / Comments / Methods Summaries
Discussion TBD
Initial Hold [0-2000]: 0.994 (1.0/0.0)
Cycle Adjust [36000]: 0.99 (0.2/0.8)
Launch Peaks [72400]: 0.989 (0.8/0.2)
Dogleg [139500]: 0.988 (0.9/0.1)
Pinch Zone [370250]: 0.9895 (0.9/0.1)
[368000]: 0.991 (0.92/0.08)
[370250]: 0.9895 (0.9/0.1)
[372500]: 0.9875 (0.92/0.08)
Blip B [401000]: 0.9905 (0.97/0.03)
Blip A [429800]: 0.992 (0.98/0.02)
Final Phase Shift [452658]: 0.993 (0.98/0.02)
Method Summaries
Discussion TBD
Section List
Sine Sweep
Up / Comments / Phase Shifting
See Kirk Samulski for information about how he set up the sine sweep for the testing that was analyzed here.
Phase Shifting
In the future, detailed notes will be added here to explain how to adjust the ScaleF parameters to adjust the phase shift between the dynamometer signal and the system load cell signal. Simply described, the ScaleF parameter is adjusted to move the error signal left and right. As it moves the cyclic error will change amplitude. You adjust the phase shift so that the peak of the error is aligned with either the peak or the valley of the dynamometer and test system cell’s signal. (fjaa120021c).
Scaling
Up / Comments / Offsetting
Once the phase shift as been adjusted to align error peak with signal peak/valley, then adjust ScaleD for the flattest error plot. (fjaa120021d)
Offsetting
Up / Comments / Sine Sweep
Finally, after the scaling has been adjusted, adjust the OffsetD value to center the error plot around 0. (fjaa120021d)
Tutorials
Up / Comments / Ramp Up-Adjust
This section accumulates links to references which explain topics related to this post’s content. The comments accumulate the information initially. Then those items that seem to be of greatest importance will be migrated to this section and for some they will rise to their own section or even their own post.
The initial material that gets described in a comment may in fact simply be an ID for an external discussion. The discussion may be a text or email thread, minutes from a meeting, or potentially even one or more social media posts.
To get started then, follow the comments link above, just below the Tutorials subheading. There you will find the latest links to in progress tutorials.
Document Navigation
Up / Comments / Getting Started
TopicID: fjaa113036
Navigation can be viewed in 3 groups; page scrolling, document links, and TopicID searches.
Scrolling:
This is done in the usual manner, just as with any other document. For short reports or for short sections within a larger report this typically works very well.
Document Links:
For longer documents, there may be an outline. Even in documents without an outline, the line of text directly beneath the bold text of the section heading will be links to go to standard locations.
Top: goes to the very beginning of the document
Up: Goes to the section that, in an outline form, would contain the section currently being read.
Comments: Goes to the comments at the end of the document that are specifically about the section being read.
TopicID searches: For some sections, just below the section’s navigational links will be the TopicID line. Copy the text directly to the right of the TopicID label and then use the document’s find function to look for all occurences of the ID. An author will use this technique if they subject matter of that topic is best understood by reading material that is in multiple non-contiguous sections of the document.
Getting Started
Up / Comments / Making Adjustments
Discussion TBD
Making Adjustments
Up / Comments / Document Navigation
Discussion TBD
Ramp Up-Adjust
Up / Comments / Cycle-Adjust
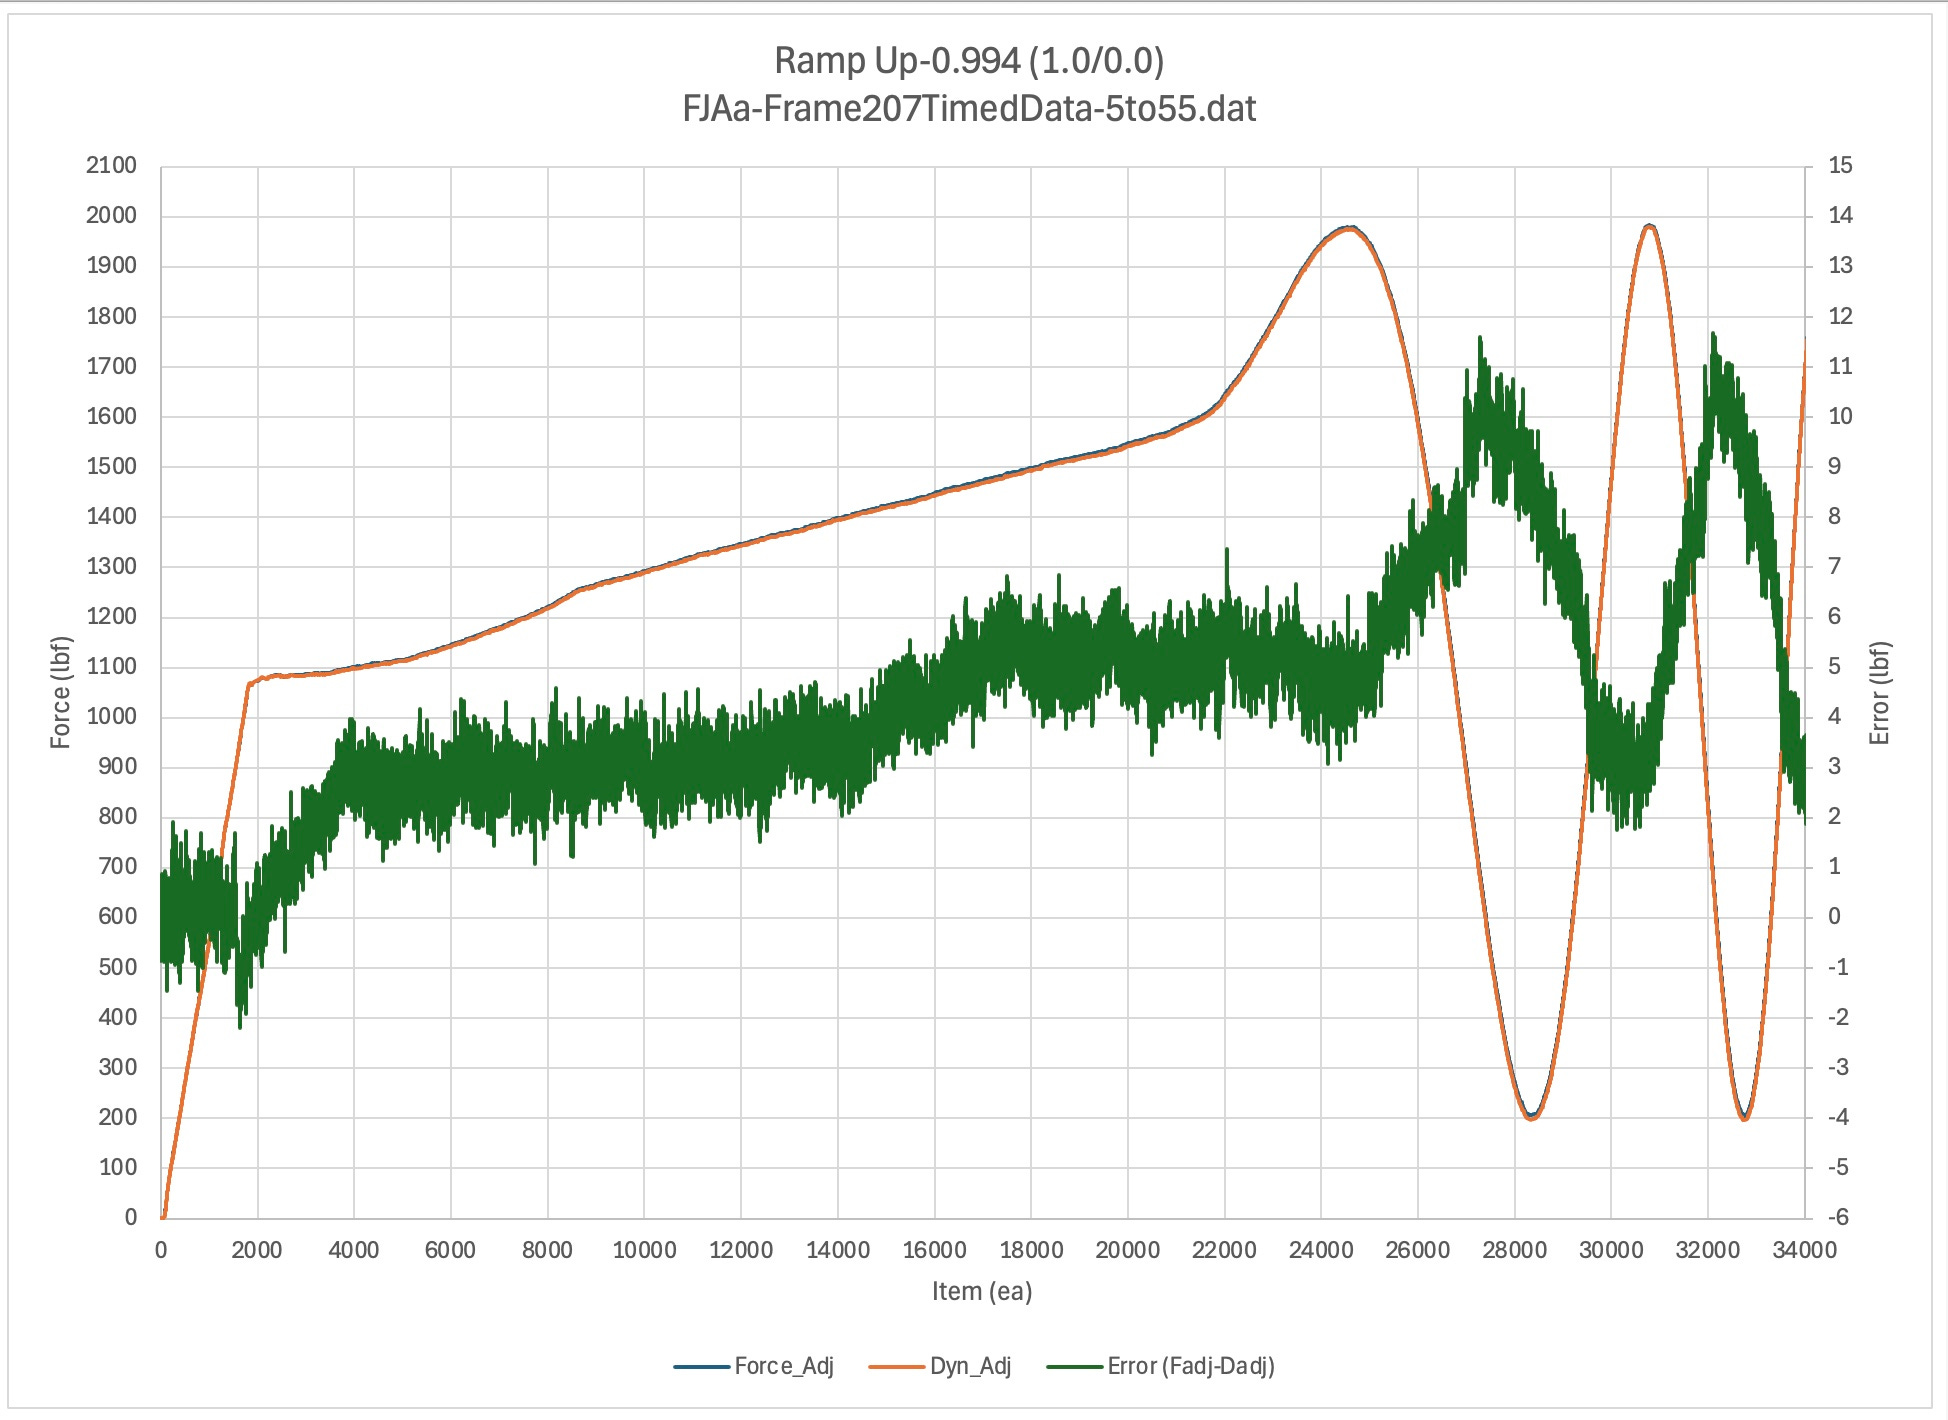
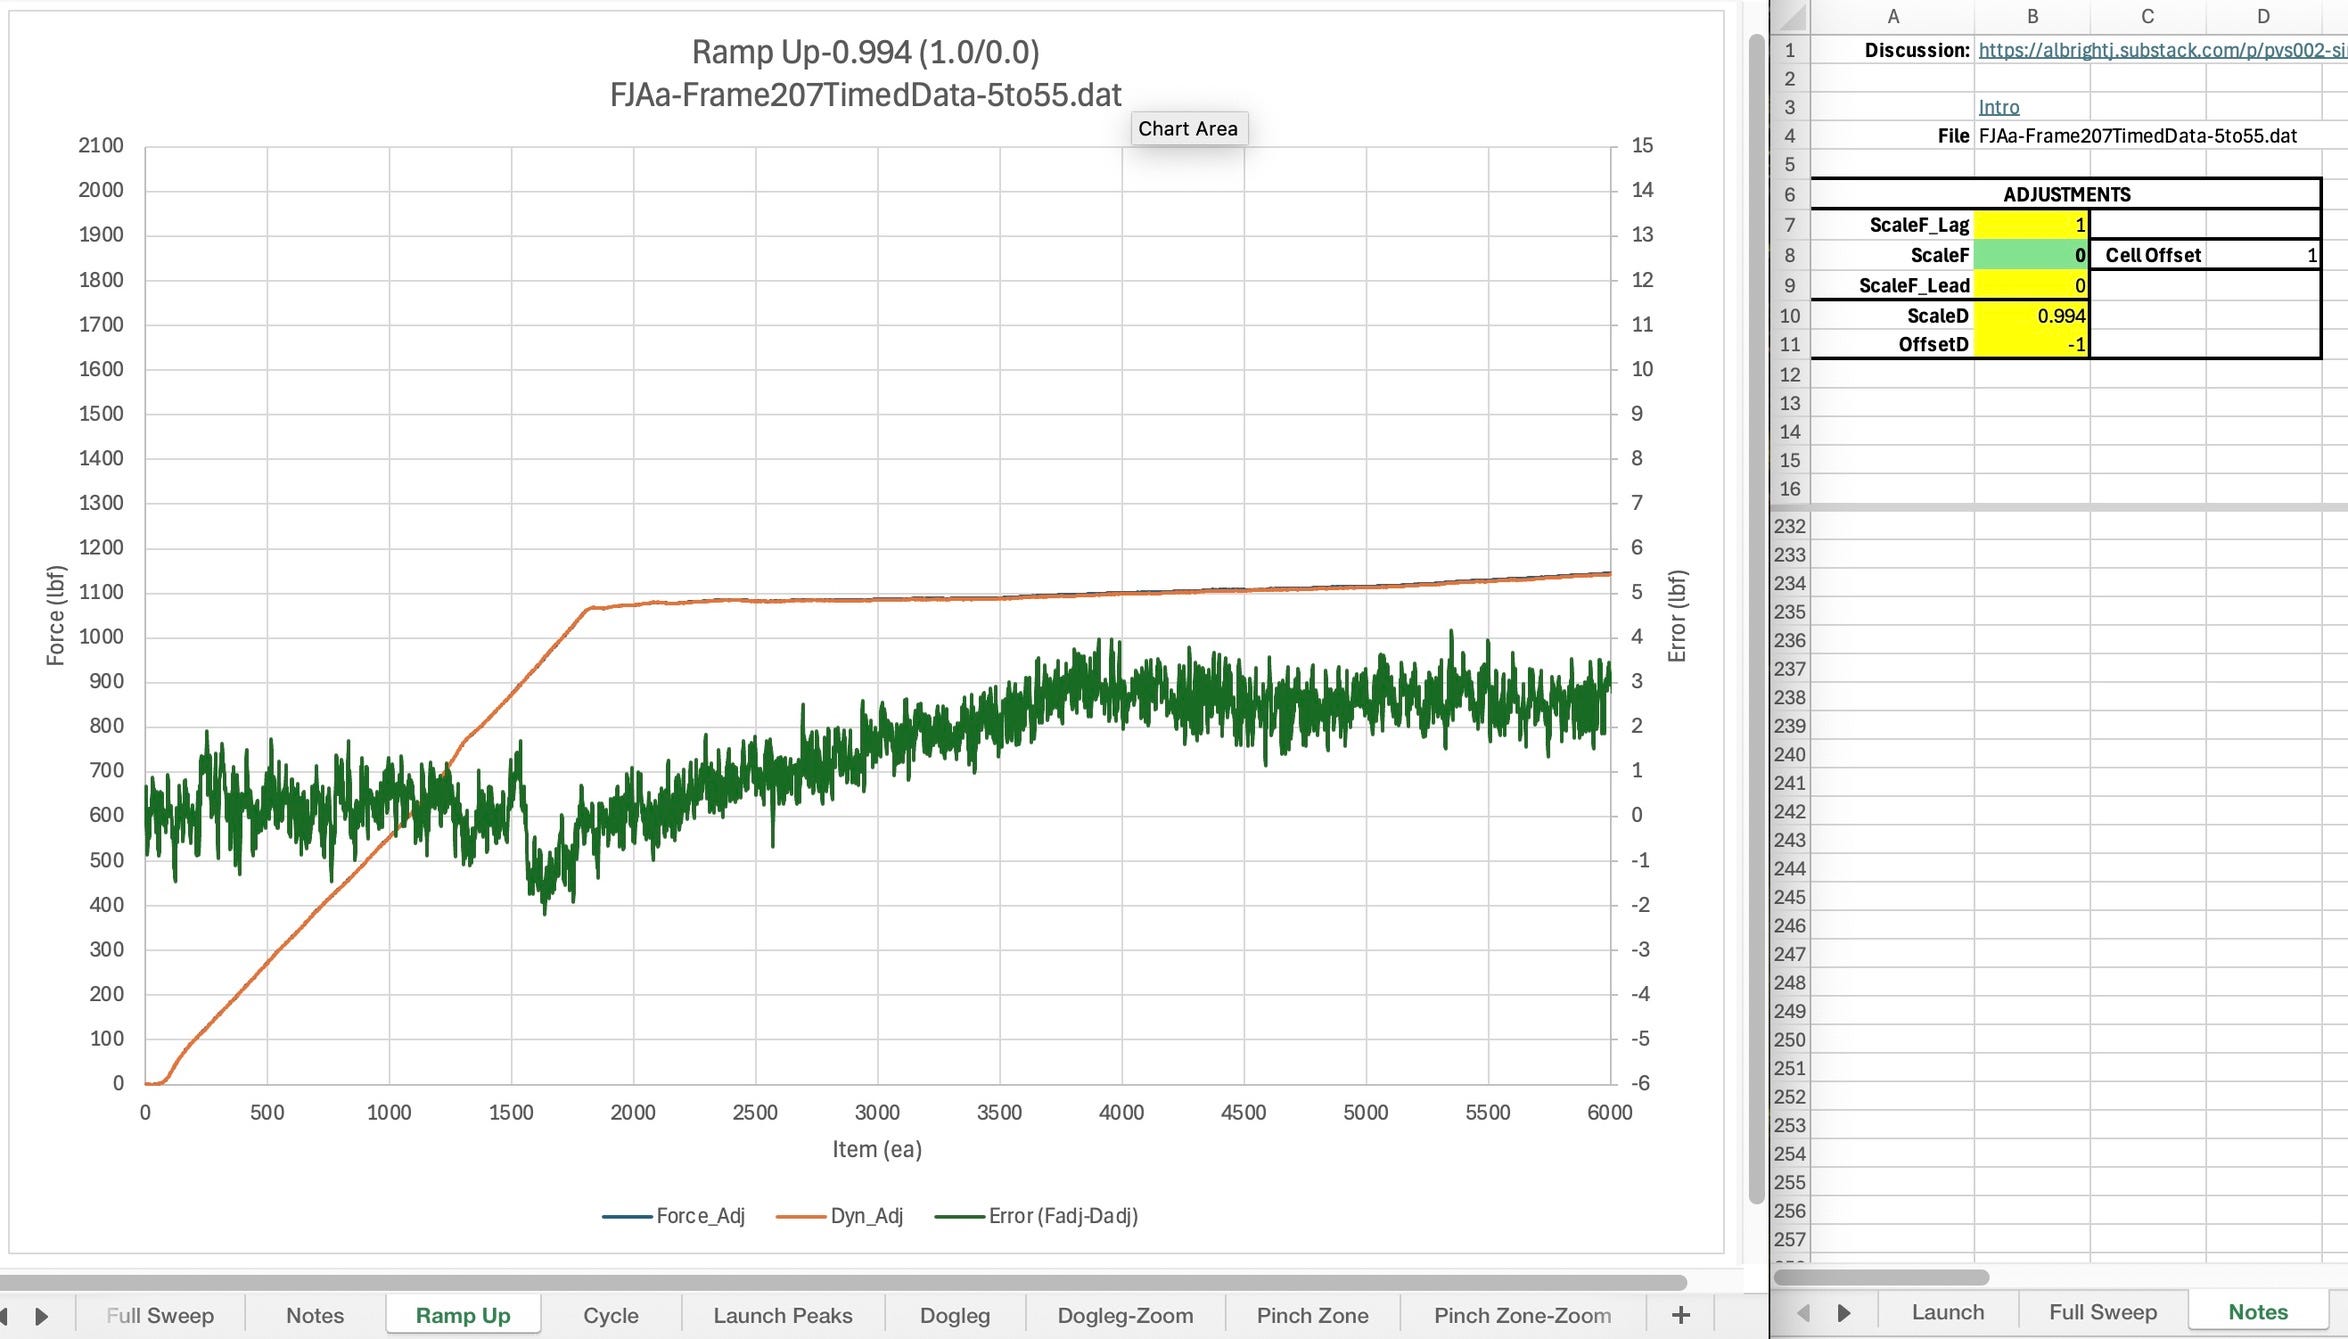
These figures show how the error changes in this quasi-static operating region as adjustments are made to the phase, scale, and offset. The fact that the error curve is not a flat line with a noise band around it in this region appears to raise significant questions about the central premise of E467. That is, the notion that the dynamometer and the system load cell will provide the same values at low frequencies and only deviate as frame acceleration increases enough to generate significant inertial force errors. (fjaa120021a)
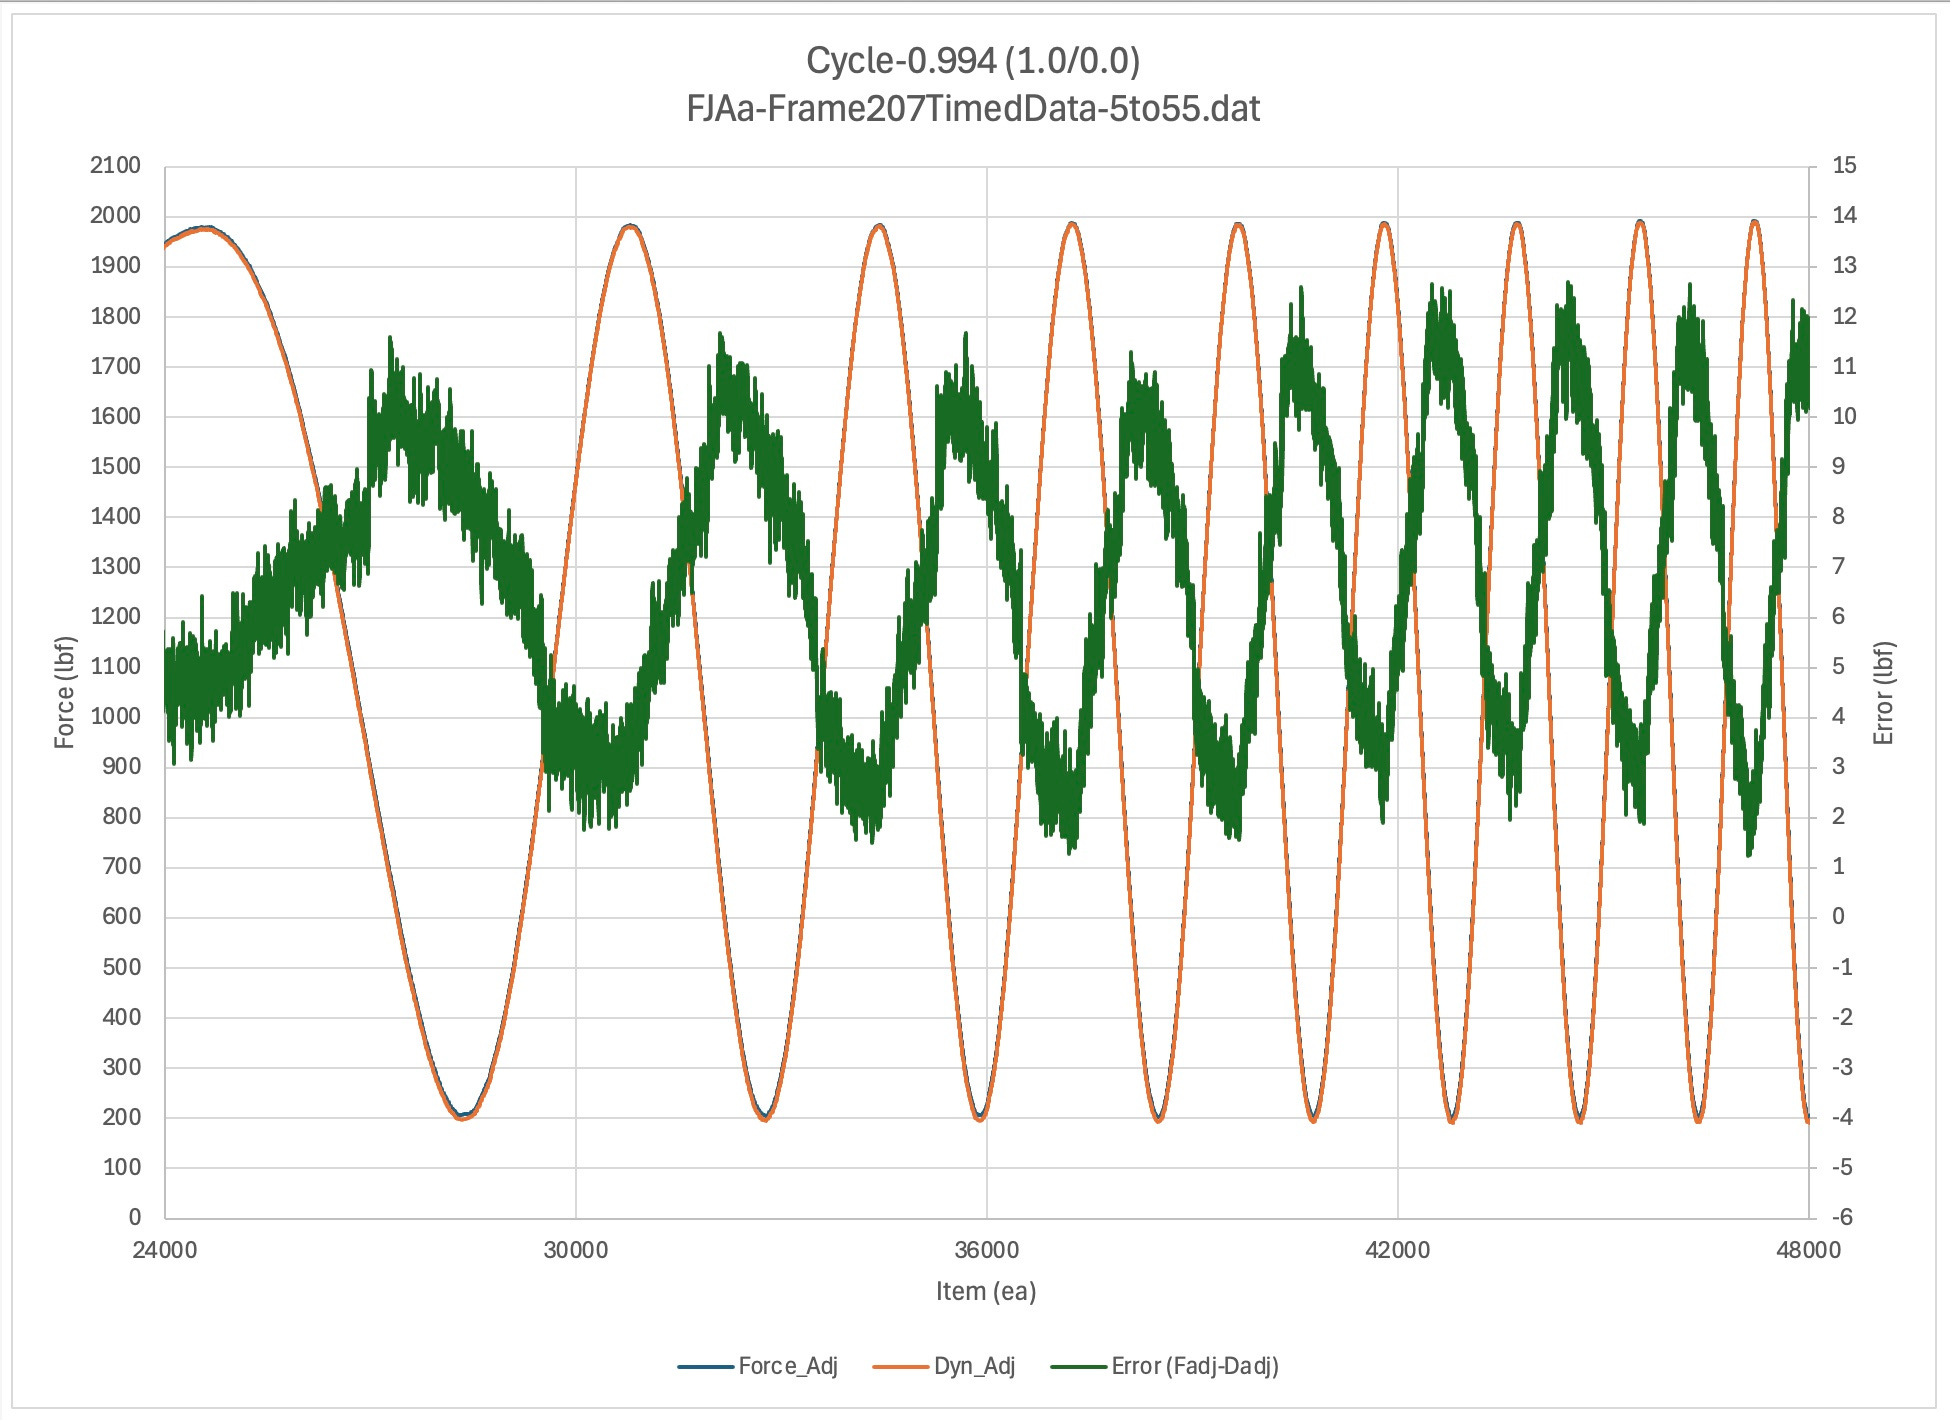
Cycle-Adjust
Up / Comments / Launch Peaks-Adjust
Discussion TBD
Launch Peaks-Adjust
Up / Comments / Pinch Zone-Adjust
Discussion TBD
Pinch Zone-Adjust
Up / Comments / Blip B-Adjust
Discussion TBD
Blip B-Adjust
Up / Comments / Blip A-Distortion
In this section, note how each of the adjustments changes the phasing and/or amplitude/offset of the error signal. The specific adjustment values used for each plot are shown in the spreadsheet table to the right of the plot. (fjaa120021b, fjaa120021c, fjaa120021d)

Blip A-Distortion
Up / Comments / Taper Off-Amplitude Depedence
Discussion TBD

Taper Off-Amplitude Dependence
Up / Comments / Launch Region
Discussion TBD
Sine Sweep Trainer
This section explains how to use an existing sine sweep study workbook to analyze system measurement behavior. It also will show how to make a new one from an existing one, inserting new test data to replace the existing data.
The workbooks used with this post are in the ASTM Collaboration Area 80292 files area for the Performance Studies. It is recommended that you download the file FJAa-SineSweep_Trainer-mini from there in order to follow along with the discussion. As this section is very much in the early stages of development, refer to the Notes for the most up to the minute information.
See the detailed discussions below for specific information about the main 4 regions:
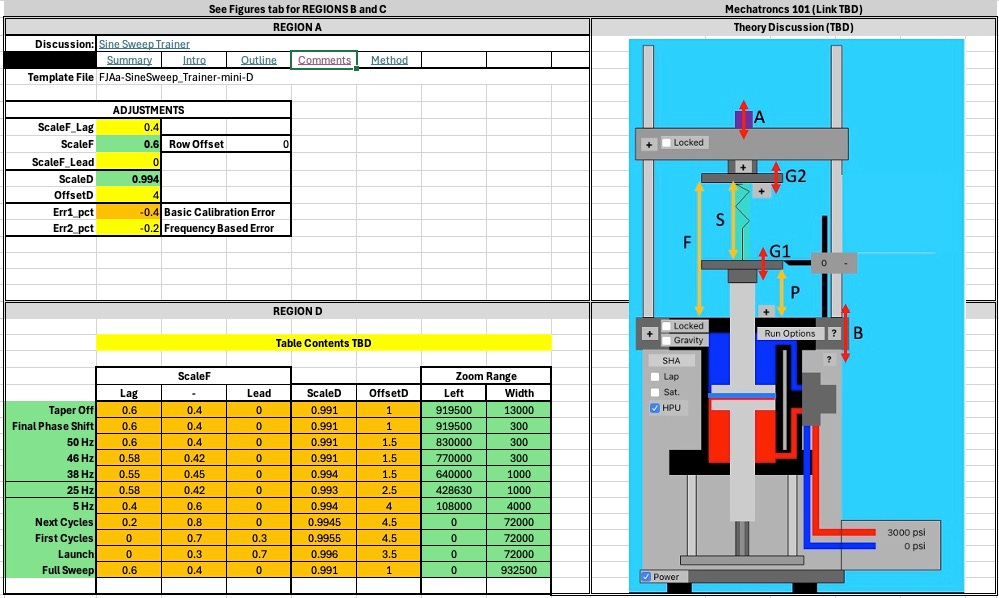
Region A: Adjustments
Region B: Launch Error Plot
Region C: Full Sweep Error Plot
Region D: Sweep Region Parameters
Analysis: Building The Workbook
Region A
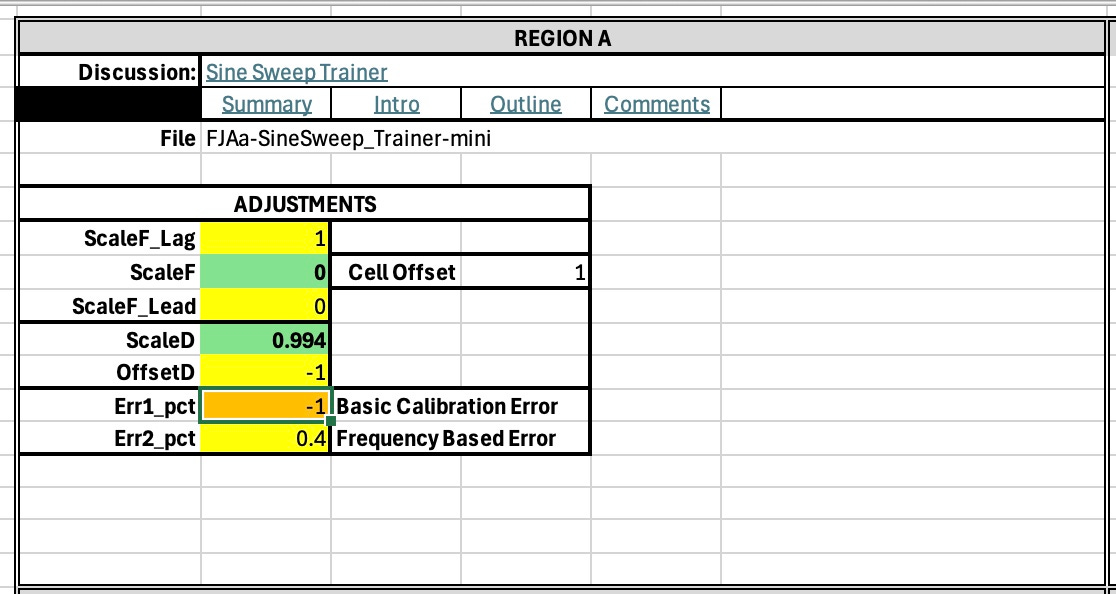
Discussion TBD
Region D
This table shows the phase shift (i.e. ScaleF), scaleD and offsetD values that got good error results for each of the Zoom Ranges listed. (fjaa120021b, fjaa120021c, fjaa120021d)
Region B
Discussion TBD
Region C
Discussion TBD
Figures
Up / All / Notes
Building The Workbook
Up / Notes / Next / All (N149811290)
Nominally speaking, what is needed is to paste the new test data into the first columns of the SineSweep_Trainer-mini. Refer to the opening paragraphs of this document section to get the SineSweep_Trainer-mini.
Then you fix the calculations in the Force Adj and Dyn Adj columns The Error column also has calculations but should not need changes. Next, fill down the calculation columns (Force Adj and Dyn Adj) and the Error column. Then you should be good to go.
What follows is a more specific set of steps. Use the Notes link for any step to get to further discussion about how to do that step.These steps presume that you have FJAa-SineSweep_Trainer-mini (Notes-TBD) or equivalent as your starting point.
Import your test data (Notes-N150156101)
Sample data (Notes-N149091116)
Fix the calculations (Notes-N150155989)
Change
Fill down
Study plot(s) (Notes-N150155833)
Outline
Up / Comments / Introduction , Outline
The outline below points to the major sections of this document. Items that have a name and “WIP” after them are sections currently being expanded. Unmarked ones with a link are started but not necessarily finished. Items with an asterisk (*) after them are nominally ready to use. The more asterisks, the more complete and/or higher the quality of the content.
The typical layout of any section of this document is illustrated with the Sine Sweep example below:
Summary *
The general procedure for the sine sweep is as follows:
1. Attach dynamometer to load train. Allow dynamometer to stabilize. Exercise dynamometer through the load range to be recorded.
2. Set frame to zero load per load cell. Allow dynamometer to stabilize.
3. With load cell at zero load, zero dynamometer.
4. Record synchronized timed data, including load cell force and dynamometer force, at the frequencies and the load range desired.
5. For the sweep, begin recording at or below the frequency of interest. Then increase the frequency at a slow rate, monitoring the test machine to ensure it controls properly, reaching the intended peak and valley endlevels. A suitable rate may be 0.25 Hz / s. When the frequency has met the maximum desired, recording and cycling may be stopped.
Proposed Process (fjaa110012)
********
This comment thread accumulates notes about the general sine sweep testing and analysis process. Replies to this comment include individual comments for each step of the process. Also additional material that may be helpful. Thus if you have issues with a specific step you can reply to the step specific comment. If you have general issues you can reply to this comment.
========
Primary Process Steps
*) Collect data (N149811588)
*) Integrate with workbook (N149811290)
*) Compute Full Error (N149810991)
*) Plot full error signal (N149810674)
*) Select target region (N149810173)
*) Adjust phasing, scale, and offset (N149809805)
*) Check dyno scale (N149809455)
*) Proceed with test (N149808798)
========
Special Topics
*) Email discussions (N149853436)
========
Post: https://albrightj.substack.com/i/165973034/proposed-process